
All DataHaven Programs, Community Wellbeing Survey, Health
A Citywide Health Check-up, Neighborhood by Neighborhood
By Camille Seaberry
[Excerpt]
Take a close look at the neighborhood-by-neighborhood data from the 500 Cities project, a new collaboration by the CDC, the CDC Foundation, and the Robert Wood Johnson Foundation, which shows us both successes and disparities in the health of Connecticut cities.
The project’s innovative statistical estimates are published for all neighborhoods in the nation’s 500 largest cities, including New Haven and seven others in Connecticut, allowing public health practitioners and the general public to understand health care, health outcomes, and health-related behaviors at a hyper-local level.
Click here for a full report on the new data by DataHaven, which has been studying the new 500 Cities dataset with its statewide colleagues, and comparing it to measures collected directly through in-depth, live interviews with more than 16,000 randomly-selected adults around Connecticut. DataHaven has also created online maps to explore the data.
Here is a brief summary of the new report, from Camille Seaberry and Mark Abraham at DataHaven:
Understanding the social determinants of health — the ways individual health is linked to neighborhood conditions, location, and socioeconomic factors — is central to the purpose of the 500 Cities Project and is crucial in a state so often marked by inequities.
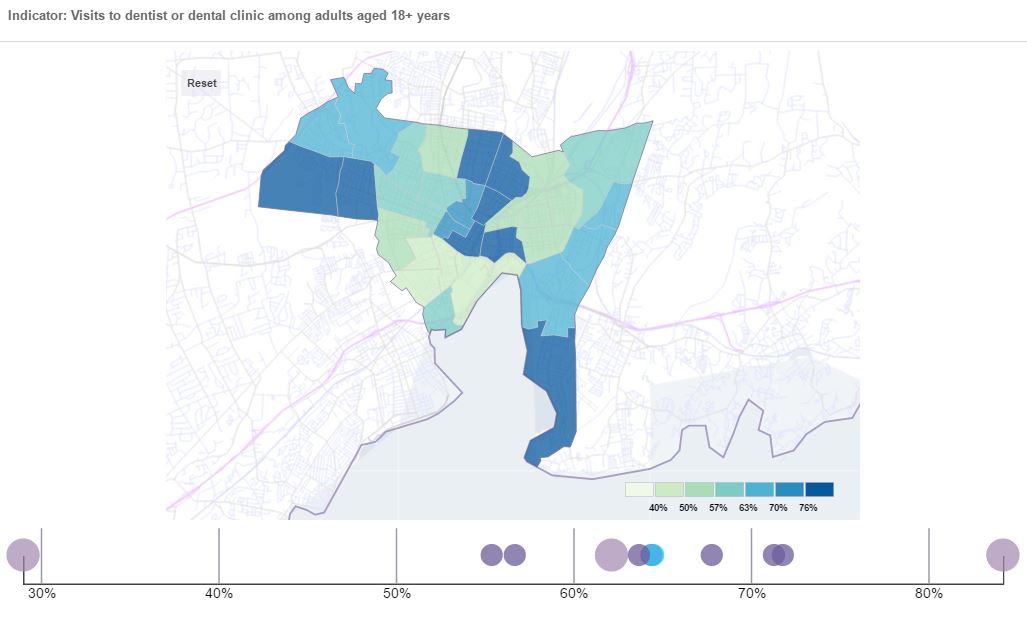
To analyze these disparities, we split these eight Connecticut cities into higher-need census tracts — denser areas with higher poverty rates and lower household incomes — and lower-need tracts — those less densely populated and economically better off. We see a familiar pattern of better results in wealthier areas, and health problems concentrated in lower-income areas. For instance, there is a 12 point gap in the rates of health insurance coverage among working-age adults between these two areas, and a 15 point gap in rates of recent dental visits. Higher-need tracts also have more variation on many measures, such that those tracts are more likely to stray toward greater extremes.
We also looked at the data from the 2015 DataHaven Community Wellbeing Survey with areas split into these same two groups. In addition to measures of public health and behavior, the survey asked questions about overall well-being, such as how responsive participants feel their local government is, trust in police, how easily they think residents in their area can get a job, and rates of food insecurity.
As reported in more detail in the New Haven Independent last year, differences across these areas appear within New Haven: there are 11 percentage point gaps, for example, both in the share of adults who report trusting police, and in the share who feels local government is responsive to their needs, even though they are served by the same police department and city hall. In both the direct interviews as well as the statistically modeled estimates, the percentage of adults who do not have access to regular dental care ranges from about 20 percent of adults in Westville and East Rock to about 50 percent of adults in the Hill.
Behind these data points are people’s lives and experiences. Linking public health data with data on community well-being can help us add nuance to the stories we tell about disparities, and paint a more robust picture of the health of our residents and their neighborhoods.