
Understanding How SNAP Impacts Connecticut Communities Through New Data from DataHaven and State Sources
Using data to explain the local impacts of SNAP benefits
By Nat Markey, Andrew Carr, Camille Seaberry, and Mark Abraham, DataHaven
At a time of historically high food insecurity and rising costs of living in Connecticut, the Supplemental Nutrition Assistance Program (SNAP) remains one of the most important tools for helping families keep food on the table and ensuring that children get the nutrition they need to stay healthy. SNAP benefits also support businesses and create local jobs.
In 2025, both the government shutdown and H.R.1 (also known as the “One Big Beautiful Bill Act”) have endangered food assistance for a large share of Connecticut’s population. The shutdown disrupted $72 million in food assistance for about 360,000 Connecticut residents, leaving families under strain and food pantries overwhelmed. But even after the shutdown ends, about 58,000 families in Connecticut are still projected to lose significant SNAP benefits (an average of $194 in benefits each month) due to the permanent changes in H.R.1.
Facing these uncertainties and unprecedented impacts to the social safety net, nonprofits, journalists, and local elected officials have increasingly turned to DataHaven for clear and reliable local data on who benefits from SNAP and what is at stake for communities across the state. This report highlights key data sources – three new DataHaven reports plus a state dashboard – that can help you understand SNAP’s impact in Connecticut.
SNAP in the 2025 DataHaven Survey
The 2025 DataHaven Community Wellbeing Survey (DCWS) provides an up-to-date look at food security and SNAP participation across Connecticut. The results illustrate both the reach of the program and the ongoing challenges residents face. For example:
- One in five adults report that they or someone in their household has received SNAP within the past five years.
- Thirteen percent of adults say that they or someone in their household received SNAP within the past month.
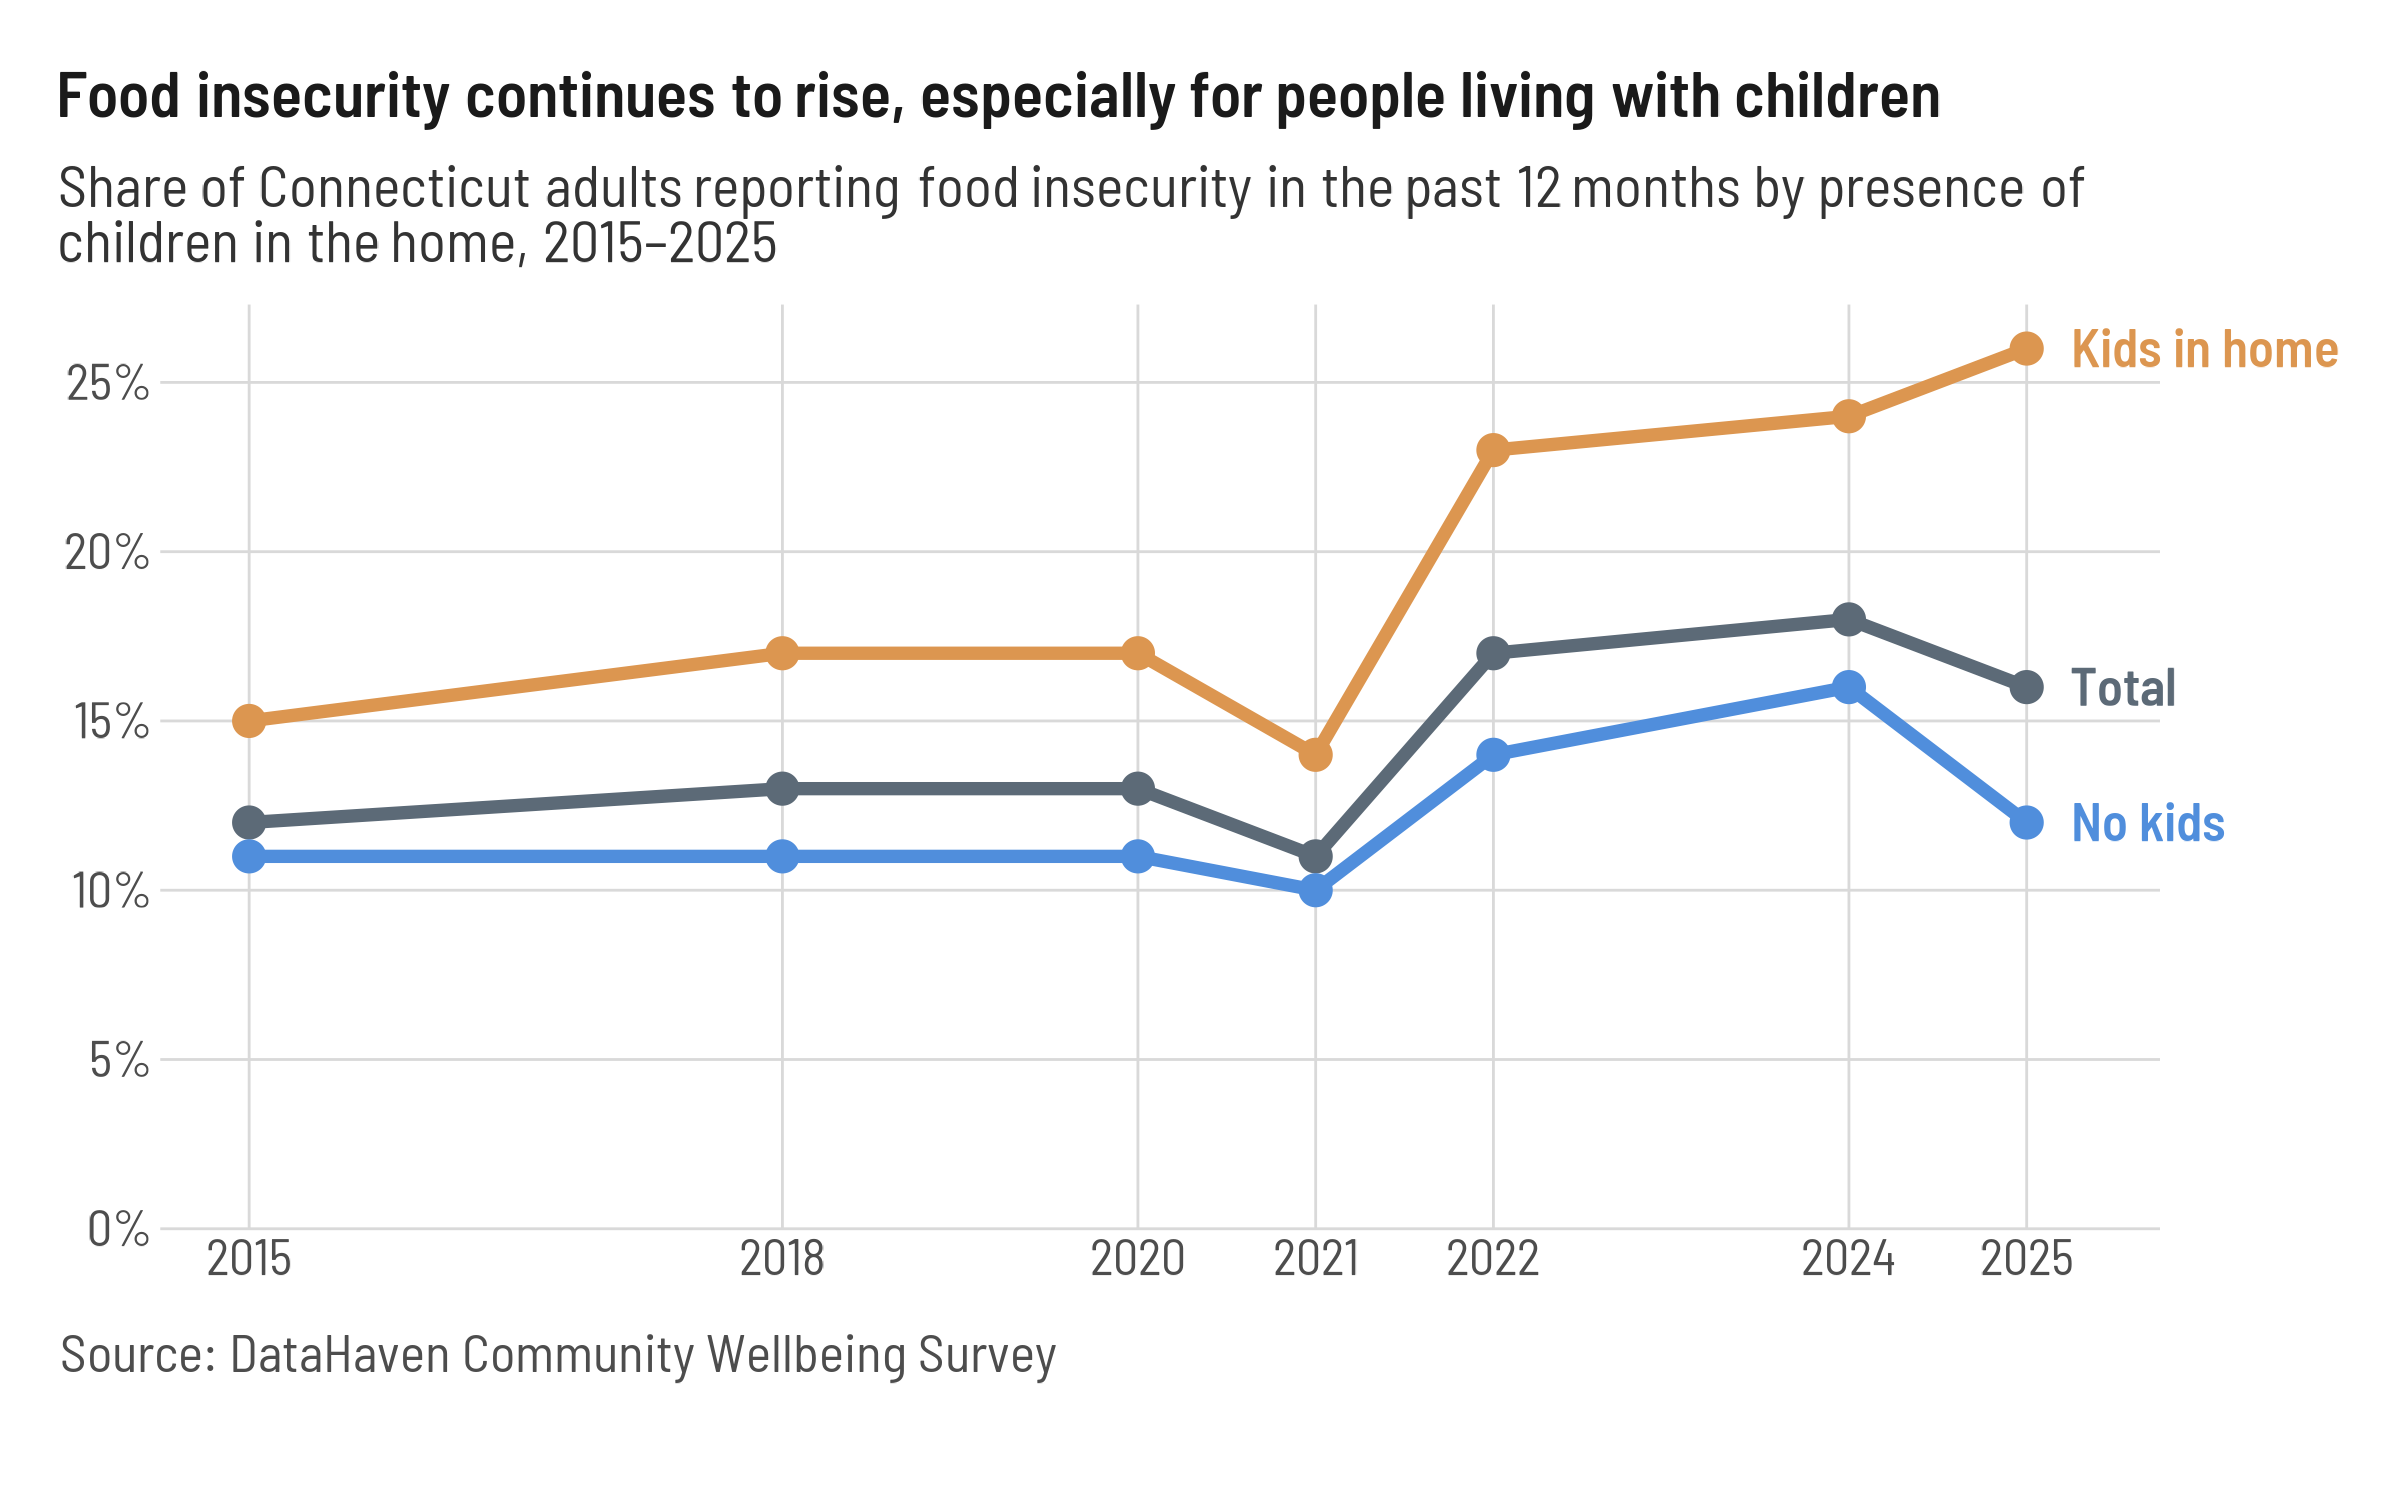
- Sixteen percent of adults statewide, and twenty-six percent of adults with children, report that they ran out of money for food in the past year. In some city centers, as many as half of adults with children report food insecurity.
For adults with children, the food insecurity rate hit an all-time high in the 2025 DCWS, climbing strikingly from a record low in 2021, when the expanded Child Tax Credit helped families and slashed child poverty nationally.
In addition, the 2025 DataHaven survey reveals widespread concern about the strength of the social safety net. More than half of Connecticut adults believe the government provides too little assistance to help people afford food, while only twelve percent say the government provides too much.

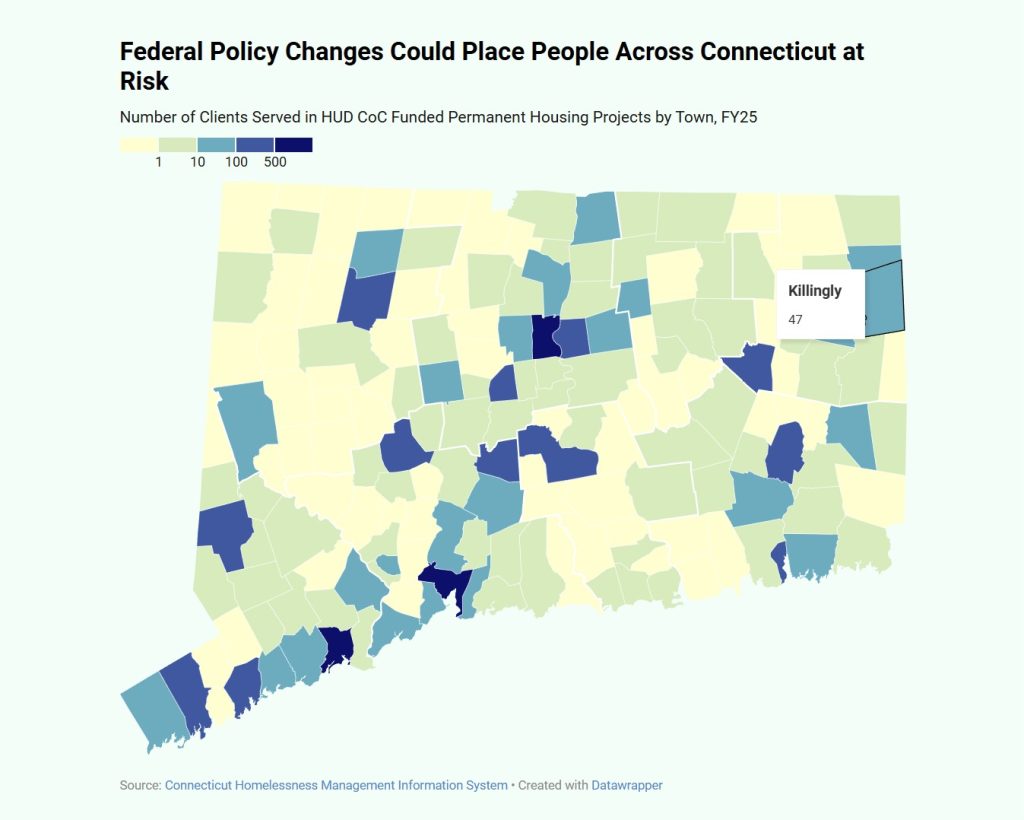
About seven in ten adults are concerned that current policies will make it harder for people to access food, health care, and housing. In addition to the SNAP report discussed below, DataHaven recently published a report illustrating the local Medicaid/HUSKY and Access Health CT coverage losses by town and legislative district as a result of federal budget cuts and policy changes.

While SNAP supports people across the state, it is disproportionately impactful for certain groups. For example, according to the 2025 DCWS, those reporting that they or someone in their household had received SNAP within the past five years included 20 percent of all adults statewide, but 61 percent of adults with an annual income of less than $30k, 35 percent of adults from Urban Core towns, 43 percent of Black adults, 34 percent of Latino adults, 43 percent of adults with a high school education or less, 29 percent of adults with children in the home, 32 percent of disabled adults, 54 percent of adults who have been incarcerated two or more times, and 32 percent of adults identifying as LGBTQ.
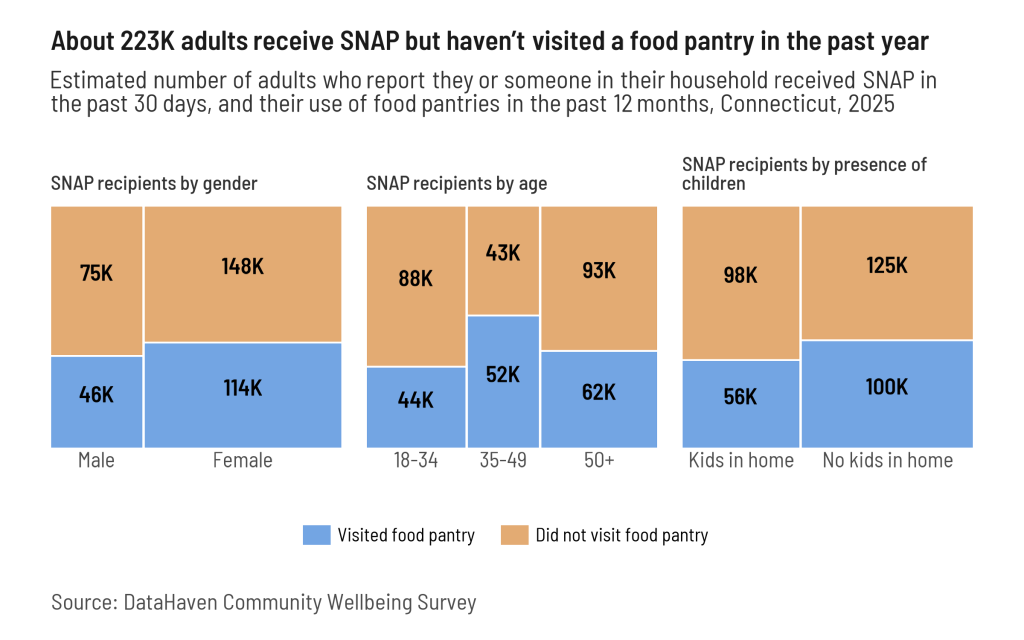
Community organizations and volunteers play a critical role in the food system, but they cannot replace the scale of federal programs. According to the DataHaven survey, fewer than half of adults whose households currently receive SNAP reported using a food pantry, food bank, or emergency food service in the past year.

As Jason Jakubowski, President and CEO of Connecticut Foodshare, explained in a recent interview, “SNAP is the first line of defense against hunger. For every meal food banks supply, SNAP provides nine.”
New DataHaven Estimates: Overall Impacts of SNAP in Connecticut Communities
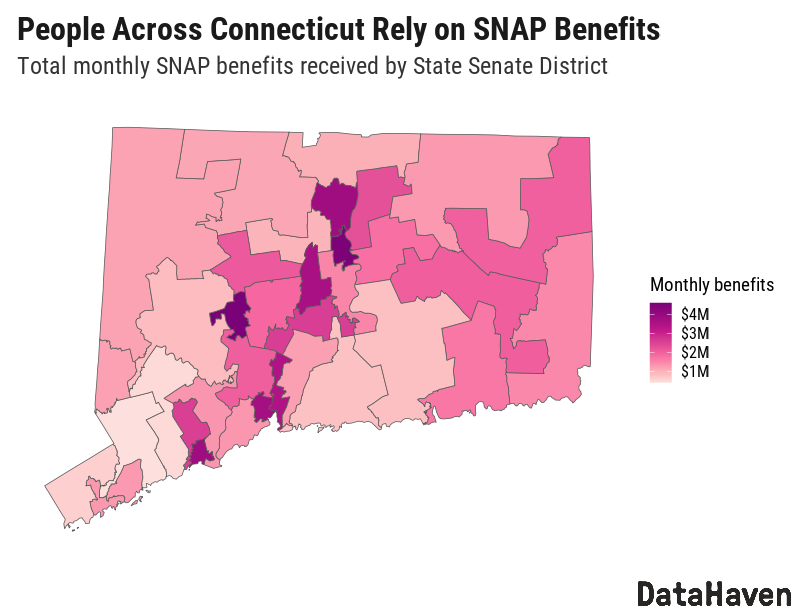
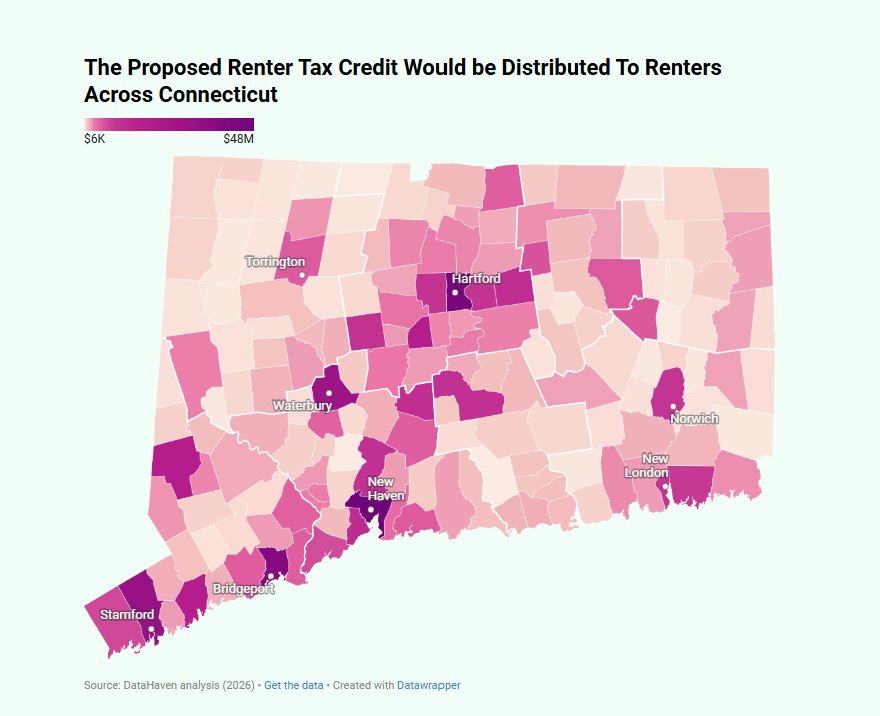
For this report, to get a sense of SNAP funds that could be at risk throughout the state now or in the future, DataHaven estimated the total benefits received per month in each Connecticut town and state legislative district. DataHaven estimates show that:
- Hartford receives over $7 million in monthly SNAP benefits.
- Bridgeport, New Haven, and Waterbury each receive more than $5 million per month.
- Smaller towns such as New London, Torrington, Norwich, and Middletown each receive over $1 million per month.
Across Connecticut, residents collectively receive about $72 million in SNAP benefits each month, providing critical support to households and helping to sustain local businesses. Overall economic benefits are even greater: a 2019 USDA report found that each dollar of SNAP funding generates $1.50 in total economic growth.
November 2025 SNAP payments have been in limbo during the government shutdown, with the Trump administration seeking to block the distribution of any benefits. This represents the first time in the 60-year history of the program that benefits have not been distributed. On November 8th, Connecticut Governor Ned Lamont announced that full November SNAP benefits had been loaded onto Connecticut SNAP recipients’ EBT cards. On November 10th, the Trump administration appealed to the Supreme Court to freeze payments. Meanwhile, Congress may soon end the shutdown and ensure SNAP funding, at least for a period of time, but fear and uncertainty about access to food will continue as H.R.1 legislation permanently reduces or eliminates SNAP benefits for many families (see section below).
These maps display estimated total monthly benefits by town and State Senate District, as well as a spreadsheet containing the underlying data at the town, State Senate District, and State House District level. To access these data, please download the accompanying spreadsheet.

DataHaven Report: Projected SNAP Cuts by CT Town and District due to H.R.1.
In early October, DataHaven published a report analyzing the projected losses of SNAP benefits across Connecticut due to federal H.R.1 (the “One Big Beautiful Bill Act”). The DataHaven report includes data and maps showing the number of families in each Connecticut town and legislative district that are estimated to lose $25 or more in SNAP benefits per month under this new federal legislation. The report also provides a projected range for total dollar value of benefits losses each month by town and district. To download or view town and district-level SNAP data, navigate to the “Interactive Maps and Data” section of the report. When using one of the interactive maps, find data for a specific town or district by hovering over it with your cursor. The report also provides a spreadsheet with all of this information.

Data from Connecticut DSS
The Connecticut Department of Social Services (DSS) publishes data on the people that the agency serves through various social programs, including SNAP, on its DSS Dashboard. The dashboard breaks down the number of Connecticut individuals who received SNAP benefits each year from 2012 to 2025 by town, COG, age group, race, ethnicity, and sex. In order to view data on SNAP recipients, click on “SNAP” in the “Program” panel (bottom left). To further filter for any group of interest, simply click on that group. For instance, to see data on SNAP recipients in Hartford, select Hartford in the “Town” panel.

DSS also publishes an annual People Served report, with data by town and program. To protect confidentiality, both the DSS dashboard and the People Served report suppress numbers for small groups, so some of the disaggregated data that are available for larger towns may not be available for smaller ones.
Methodology
Methodology for the DataHaven Community Wellbeing Survey can be found on the survey page on the DataHaven website, within the coversheet for the 2025 DCWS Connecticut Crosstabs.
The above DataHaven analysis of total SNAP benefits received by Connecticut town and legislative district is based on data from USDA and the Connecticut DSS. USDA’s state-level monthly tables provide the average monthly benefit received per household in Connecticut over the first eight months of fiscal year 2025, which is $323.95. To obtain town-level estimates of the total benefits received per month, DataHaven multiplied this average by each town’s total number of SNAP assistance units (i.e. households) as of August 31, 2025. The Connecticut DSS provided data on SNAP assistance units by town in response to an email request on October 1, 2025. DataHaven used town-to-district population crosswalks to produce estimates of coverage loss by State House and State Senate District.
Methodology for the DataHaven report looking at the impact of H.R.1, “Food Assistance and Local Economies at Risk: Projected Federal SNAP Cuts by Connecticut Town and District,” may be found within that report.
Methodology for the Connecticut DSS data products are available through DSS.
Related Reports


Related Data
Document
The Health and Wellbeing of Formerly Incarcerated People in Connecticut: Insights from the DataHaven Community Wellbeing Survey (PDF)
Data Resource
Connecticut Town Data Viewer
Document
Disability in Connecticut: Insights from the DataHaven Community Wellbeing Survey (PDF)
Dataset, Document
Dataset, Document
DataHaven HR1 Tax Effects Spreadsheet by Connecticut Town
Document
Wilton Town Equity Report 2025
Document