Demographics, Public Safety
Connecticut data reveal racial disparities in policing
In August 2014, the shooting of African-American teenager Michael Brown in the black-majority city of Ferguson, Missouri by a white police officer on duty quickly captured the entire country’s attention. Residents, long aware of the existing tensions between the community and a police force that no longer represents their racial and ethnic makeup, protested the excessive use of force by police and demanded greater accountability from police departments. Since then, events in Baltimore, Staten Island, Charleston, and elsewhere as well as the rise of the Black Lives Matter movement have led to increased national awareness of and scrutiny towards police departments’ relations with people of color in their communities.
Racial Profiling in Connecticut: How are we doing?
The abundance of new data about traffic stops, vehicular searches, and police department racial and ethnic diversity reflects recent efforts by state governments throughout the country to make police data better organized, more accessible, and more meaningful in response to these recent developments. One new report, published in April by the Connecticut Racial Profiling Prohibition Project, is the first annual comprehensive analysis of racial disparities of drivers during police traffic stops to come from the group, which was formed in 2012.
According to a recent article in the New York Times titled “The Disproportionate Risks of Driving While Black,” traffic stops are the most common form of direct interaction with police for many people and thus have a key role in shaping community perceptions of police. Traffic stop racial disparities also cause certain segments of the population to be exposed to the criminal justice system at higher rates, leading to disparities in the enforcement of laws.
The Connecticut report, “State of Connecticut Traffic Stop Data Analysis and Findings, 2013-14,” found that there were statistically significant racial and ethnic disparities of drivers stopped by police on a statewide level in Connecticut: black and Hispanic drivers were both stopped at a much higher rate and searched at a much higher rate than white drivers. However, white drivers are much more likely than drivers of color to be found to possess contraband in their vehicles as a result of a search.
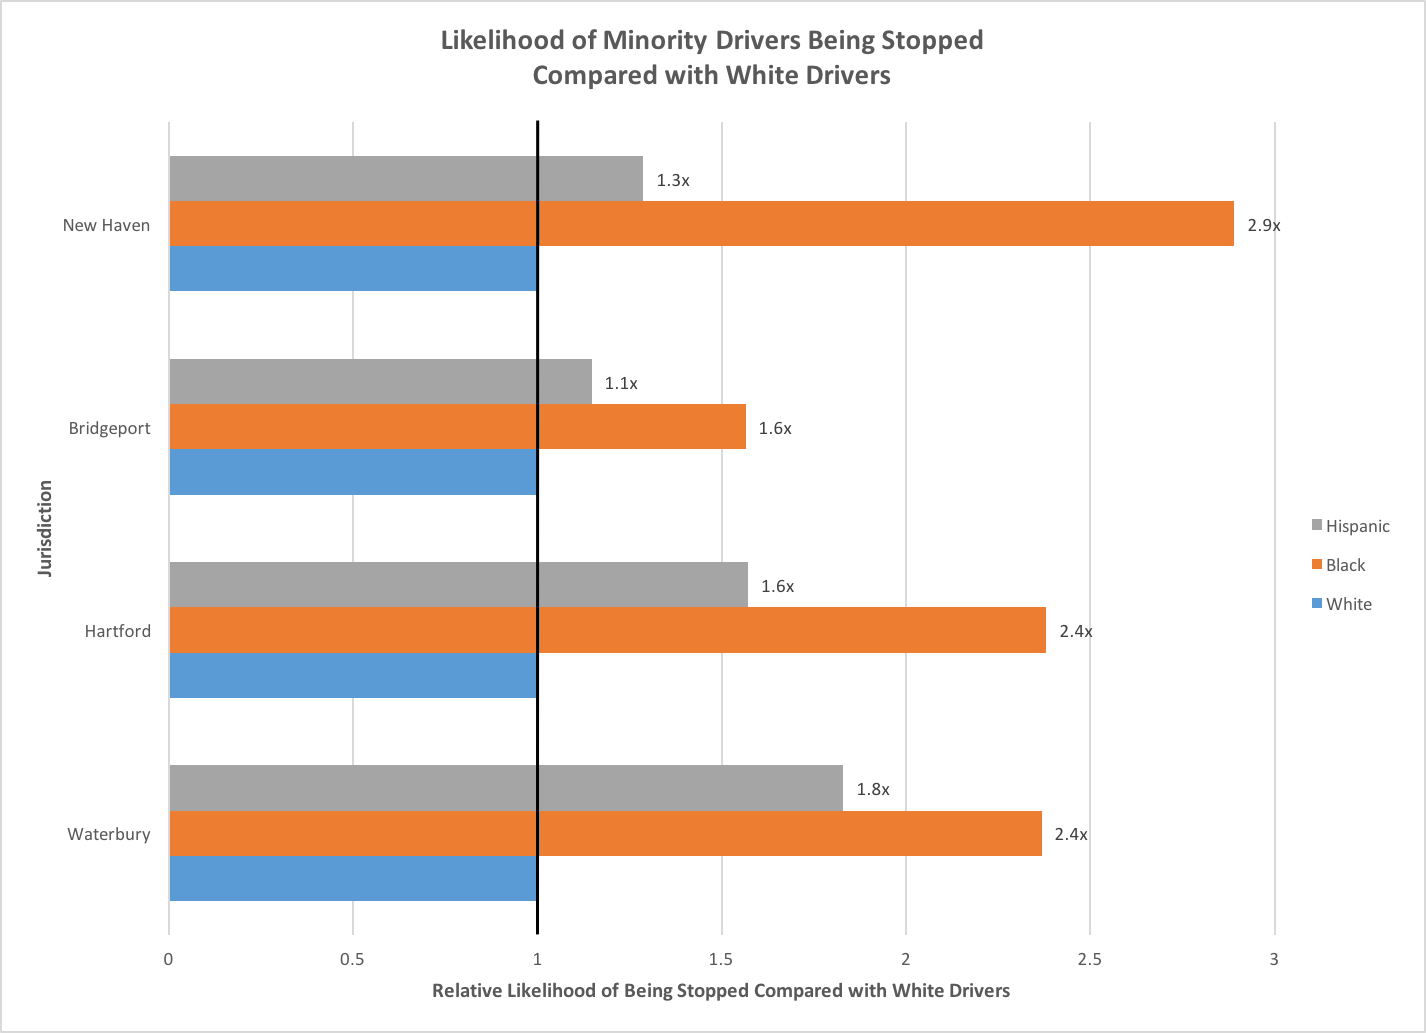
In New Haven, there were 2,454 stops during the period studied from October 2013 to September 2014. Of those, 63.3% involved minority drivers in comparison to a 46.6% minority estimated driving population, meaning that minority drivers were 1.4 times overrepresented in traffic stops. Compared to white drivers, minority drivers were about 2 times more likely to be stopped on the road. Black drivers, specifically, were 2.9 times more likely to be pulled over than their white counterparts.
It is difficult to separate racial bias from other factors that cause increased rates of traffic stops, since outcomes of low personal income may partially explain the higher traffic stop numbers for minorities. Compared to white drivers, drivers of color are more likely to have expired registrations, defective lights, and other vehicular anomalies that may catch the attention of police officers.
However, the race or ethnicity of the driver behind the wheel is a major factor. The report observed that racial disparities in traffic stops increase significantly during daylight hours, when the driver’s race is visible to an officer on patrol. This “Veil of Darkness” analysis suggests that skin color – beyond just the condition or location of the vehicle -contributes to higher rates of traffic stops in certain communities.
Ken Barone, a Policy and Research Specialist with the Institute for Municipal and Regional Policy at Central Connecticut State University and one of the authors of the report, said that different policing strategies also help explain why certain neighborhoods are “saturated with law enforcement at a much higher rate.” In Manchester, East Hartford, and Waterbury, disparities seems to be driven by heavy policing in neighborhoods that have the most traffic, which happen to have higher minority populations. In towns such as Wethersfield and Hamden, which border major cities, Barone says there exists “border patrol” where police agencies “put their resources in the neighborhoods that tend to be higher percentage minority or that border a major city that has a higher minority population.”
The previously mentioned New York Times article examined data compiled from local police agency reports in the states with the most complete traffic stop reporting from December 2013 to August 2015, placing the Connecticut report in a national context. The four states with the best traffic stop tracking – Connecticut, Illinois, North Carolina, and Rhode Island – mostly shared the same patterns: black drivers are more likely to be stopped and less likely to possess contraband than white drivers. According to data from Missouri, which has monitored traffic stop data for over 15 years, the racial disparities have only grown with time.
Minority (Under)Representation on Police Forces
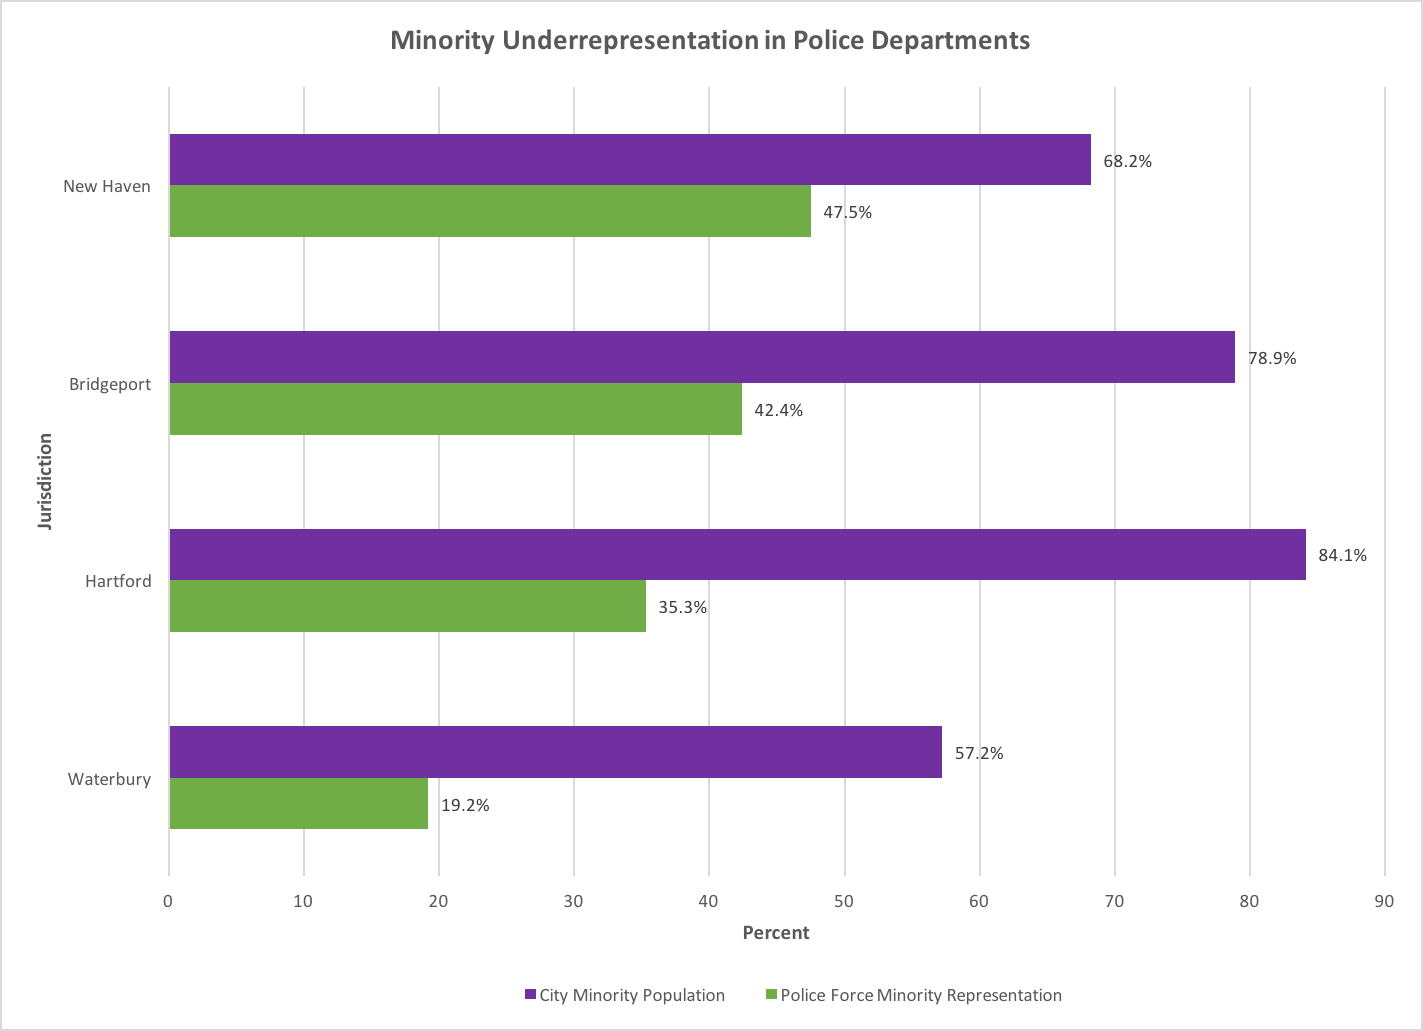
Other reports have looked at police department diversity in an attempt to explain police-community relations. A report from Governing, a monthly publication covering policy and politics for state and local government leaders, analyzed minority underrepresentation in police departments throughout the country. In New Haven, residents of color are 68.2% of the population while minority police officers make up 47.5% of the force. This makes the New Haven Police Department, with a difference of 20.7%, more representative (and closer to the national average) than other Connecticut cities such as Hartford and Waterbury. Statewide, Connecticut has the second-highest minority underrepresentation (at 36%) in the police force after New Jersey. In comparison, Ferguson, Missouri has a minority underrepresentation of 55%, a discrepancy between police and community that fueled distrust in the wake of the shooting of Michael Brown.

Barone said that his group hasn’t studied the connection between police force diversity and traffic stops. However, he thinks that departments that better reflect the community they serve can be a boon for community-police relations. “From my general experience, I do believe that a more diverse workforce – certainly a more diverse police department – can only have positive outcomes,” he said.
Yet a surface comparison of traffic stop data between New Haven and other Connecticut cities does not reveal a significant difference in levels of racial profiling that may be connected to minority representation on police forces.
Barone says that one shouldn’t be too quick to chalk up racial profiling to the underrepresentation of minorities on police forces. He cites multiple studies on implicit bias, which he says “consistently tell us that unconscious bias, particularly with the race-crime association…doesn’t matter who’s participating in the study.” For example, men and women, white and black people all tend to identify a shove from a black man as more aggressive than a shove from a white man, even when controlled for all other differences. Barone says that the benefits of a diversified police force “doesn’t mean that implicit bias isn’t still a big issue that needs to be addressed, with everybody, regardless of race or ethnicity.”
Behind the data
Racial profiling has been illegal in Connecticut since the state legislature enacted the Alvin W. Penn Racial Profiling Prohibition Act in 1999. However, several incidents in East Haven in 2012 led the FBI to charge four police officers with civil rights offenses and abuse of power. The indictment alleged that the four officers “intimidated, harassed, and humiliated members of the Latino community and their advocates” by conducting illegal and unreasonable searches of Latino-owned businesses, among other activities.
These events prompted the Connecticut state legislature to revisit the 1999 law and its enforcement over the last decade, resulting in an amended law passed in 2012 that standardized methods and guidelines for monitoring racial profiling. “Most departments weren’t collecting and then reporting the data they were supposed to be,” according to Barone. Since 2013, police departments are required to electronically submit data to the state, connecting their internal records to a centralized database, often in real time.
While about half of the states collect traffic stop data in some form, Connecticut has one of the most stringent traffic stop reporting requirements in the country, and its electronic database system serves as a model for other states seeking to improve their data collection and access.
“We’re one of the states that certainly collects a more robust set of data, not only before the stop but also what happens after the stop, what was the disposition of the stop,” said Barone. “We’re trying to paint a fuller picture of traffic data.” California recently passed a law creating a system modeled after that of Connecticut, while Oregon is in the process of enacting similar legislation.
The April 2015 report is the first to come out of Connecticut’s renewed focus enforcing the racial profiling laws already on the books. The Racial Profiling Prohibition Project will publish the next report this spring as part of a mandated annual effort to closely monitor the state’s progress toward addressing disparities in exposure to the justice system.
The report has already sparked discussions throughout the state about how departments allocate their resources, train new officers, and capture and share data with the state government and the general public.
Thomas Zembowicz is an Dwight Hall Urban Fellow based at DataHaven. Mary Buchanan, Project Manager at DataHaven, helped edit this article.
An additional source of data that readers may wish to consider is the 2015 DataHaven Community Wellbeing Survey, which completed in-depth interviews with 16,219 randomly-selected Connecticut residents this year on topics including neighborhood safety and trust, local government and police effectiveness, victimization rates, and modes of transportation.

