

The proposed Connecticut Child Tax Credit: Estimating impacts for towns, legislative districts, and households by race and ethnicity
An analysis to understand the potential impact of the proposed CT CTC on local communities
Note: Maps with local estimates are available for towns, state house districts, and state senate districts. Printable profiles for these geographic areas (in PDF format), containing additional statistical data, are also available on request.
In partnership with the United Way of Connecticut, DataHaven analyzed Census data to help Connecticut communities understand the potential impact of a proposed Connecticut Child Tax Credit (CT CTC) on local communities. We estimated how the proposed credits would be distributed across different geographic areas and by racial/ethnic group. Residents may find this information helpful when talking with elected officials about economic security, racial equity, and community well-being.
The CT CTC proposal we analyzed would allocate $600 per child annually, for up to three children per filing family. Single-filing families making less $100,000 per year, and joint-filers making less than $200,000 per year, would be eligible to receive the credit. The credit would be fully refundable, meaning that families without tax liability would receive the full value.
From July to December 2021, a Child Tax Credit at the national level provided advance payments to nearly all U.S. families with dependent children (including those previously excluded from eligibility) each month. This credit is widely considered to have had a significant impact, as it led to a large drop in food insecurity among families with children, both nationally as well as in Connecticut. We believe that a CT CTC would have measurable impacts on family economic well-being as well, assuming that it was of sufficient scale and reach.
To create local estimates, DataHaven collected counts of eligible families from the 2018-2022 U.S. Census American Community Survey. These were multiplied by estimates of the average number of eligible children per eligible family to get numbers of eligible children, which were multiplied by the $600 credit and added together to get total refund amounts for local areas including neighborhoods, towns, and legislative districts. More detail on our methodology may be found below.
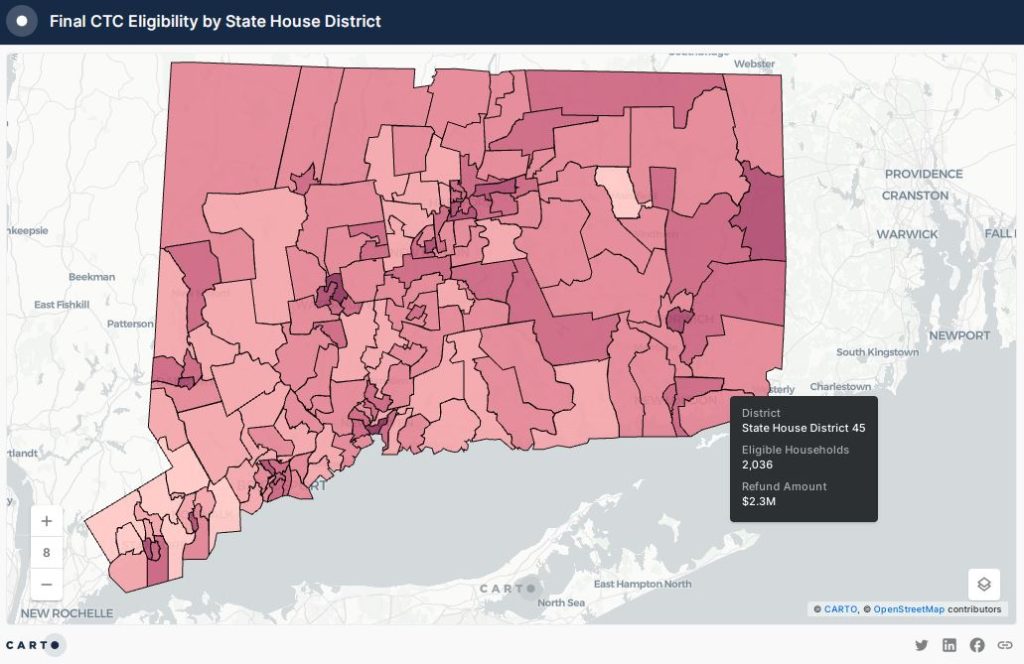
DataHaven published interactive maps for towns, state house districts, and state senate districts. These maps are also posted on the United Way of Connecticut website.
Statewide, 75 percent of all households with children would receive the credit, amounting to $306 million in refunds to 268,000 eligible families (a separate analysis published this year by Connecticut Voices for Children found that this would include about 550,000 children, or 74 percent of children statewide).
Our maps show how CTC refunds would be distributed across the state. For example, 12,317 families in Waterbury would receive $14 million under the proposed plan. Families in Norwich would receive $4 million. One of the legislative districts where families with children would receive the highest refund amount (over $11 million to 9,706 households) is State Senate District 1, covering parts of Hartford and Wethersfield.
To analyze impacts by racial/ethnic group, we estimated shares of eligible families by race and ethnicity using microdata from the Census. Our analysis found that 91 percent of Latino households with children and 88 percent of Black households with children would be eligible for the credit, along with 68 percent and 65 percent of White and Asian households with children, respectively. Eligible Latino households would receive $80 million, and eligible Black households would receive $40 million (see table).
DataHaven plans to conduct more granular analysis on how the CT CTC and other proposed statewide legislation could impact each community in Connecticut, as well as different demographic groups within each community. We will also work with local partners to make this information more accessible, including by translating it into multiple languages. Please contact us with suggestions.


Detailed methodology notes
To estimate the number of households eligible for CT CTC, DataHaven used the Family Type by Presence of Own Children Under 18 By Income table (B19131) from the 2018-2022 American Community Survey (ACS). We used this to get counts of married family households with children that make less than $200,000 and non-married family households with children that make less than $100,000, by town and upper and lower legislative district. We added these together to get the total number of eligible households. To estimate the refund amount, we estimated the average number of eligible children per family household. We used the ACS (table B17012) to get counts of family households with 1 to 2 children, 3 to 4 children, and 5 or more children. Next, we computed the average number of eligible children with the following formula: 1.5*(the number of family households with 1 to 2 children) + 3*(the number of family households with 3 to 4 children) + 3*(the number of family households with 5 or more children). We divided this by the number of eligible households and rounded the result to get 1.9 eligible children per household. Finally, we multiplied the number of eligible households in each geographic area by 1.9 * $600 (the tax credit amount per child) to get the refund amount. Using this approach, we computed 268,000 eligible households in CT, costing a total of $306 million. Although estimation methods like these do not reflect the actual budgetary impacts or actual number of families that would receive the credit, we believe that this approach was best suited to estimating the potential impact of proposed legislation given the limitations of Connecticut data on local areas and other uncertainties. At the state level, our estimates are similar in magnitude to those that have been discussed by other organizations in Connecticut.
To estimate the distribution of the CT CTC by race/ethnicity, DataHaven used data on race (RAC1P), Hispanic origin (HISP), marital status (MAR), the family presence and age of children (FPARC), and family income (FINCP and ADJINC) from the U.S. Census 2017-2021 American Community Survey Public-Use Microdata Sample (PUMS), the most recent granular dataset that was available as of mid-January 2024. These variables were used to compute counts of all families and eligible families by race and ethnicity. Households were designated a race and ethnicity based on the race and ethnicity of the householder, and family households were identified using the FPARC variable. The count of eligible families was obtained using the MAR, FPARC, and FINCP variables: unmarried families with children making less than $100,000 (in inflation–adjusted dollars) and married families with children making less than $200,000 were flagged as eligible. Eligible families were divided by all families to get shares of eligible families by race and ethnicity. These shares were multiplied by the total counts of eligible families and refund amounts estimated using the ACS data to get counts of eligible families and refund amounts by race and ethnicity.
Data were analyzed using R statistical software by Andrew Carr, Ph.D., Data Analyst at DataHaven. Mark Abraham, MPH, Executive Director at DataHaven, contributed to the project concept and data graphics.
Related Reports


Related Data
Document
The Health and Wellbeing of Formerly Incarcerated People in Connecticut: Insights from the DataHaven Community Wellbeing Survey (PDF)
Data Resource
Connecticut Town Data Viewer
Document
Disability in Connecticut: Insights from the DataHaven Community Wellbeing Survey (PDF)
Dataset, Document
Dataset, Document
DataHaven HR1 Tax Effects Spreadsheet by Connecticut Town
Document
Wilton Town Equity Report 2025
Document