
Merging 500 Cities and Connecticut Data on Health Equity
Understanding Health and Wellbeing, Neighborhood by Neighborhood

Introduction
The 500 Cities Project, a collaboration by the CDC, the CDC Foundation, and the Robert Wood Johnson Foundation (RWJF), gives researchers in Connecticut and nationwide a powerful new tool to understand health, neighborhood by neighborhood. Launched in December 2016, the project includes estimates of 28 different health indicators in three categories of measurement—preventive care, health outcomes, and unhealthy behaviors—at city- and census tract-levels for the 500 largest cities in the country. Combined, these cities represent 103 million residents, a third of the entire US population.
When looked at in aggregate, data on Connecticut’s urban neighborhoods, defined as the individual census tracts within Connecticut’s eight largest cities, are comparable to data for the country as a whole. While there are enormous differences between higher-need and lower-need neighborhoods, residents of the average urban tract in Connecticut fare slightly better than the typical U.S. resident on most measures of health outcomes, in part because of their younger median age. Unfortunately, these neighborhoods also fare significantly worse than the rest of the country on the majority of the healthy behavior and preventive care measures included in the project’s dataset. These factors, and other related “upstream” barriers that prevent residents of many neighborhoods from attaining their full health potential, must become an even-greater focus of our policymakers and public health practitioners.
About this report and data visualization
This brief report is based on our analysis of the 500 Cities data for Connecticut, as well as our experiences from attending the project’s formal launch event in Dallas, our meetings with local partners throughout Connecticut to explore the dataset, and our discussions with the project’s lead researchers.
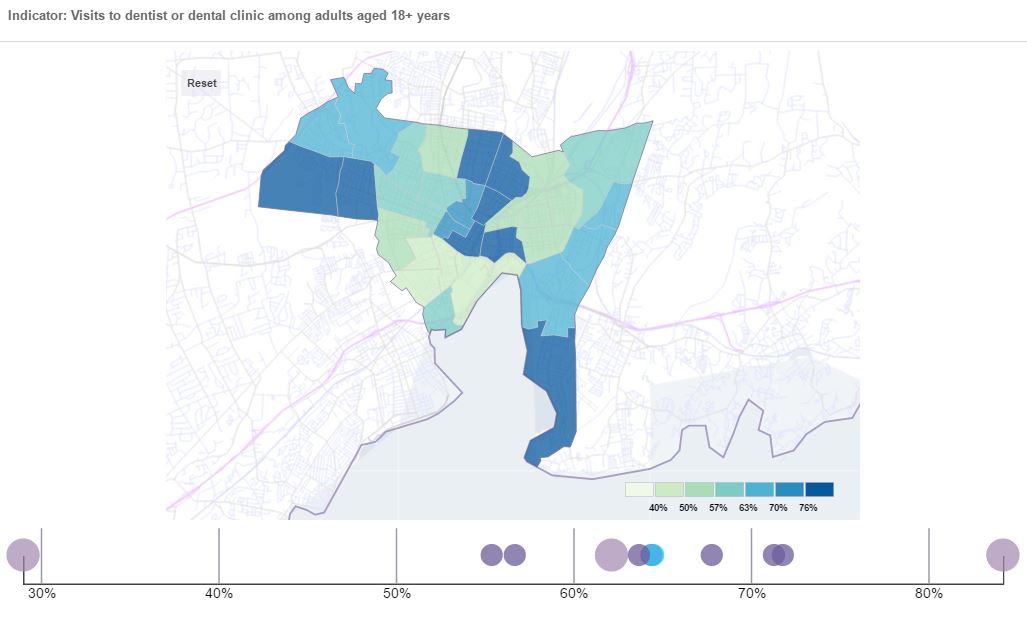
As a way to make the 500 Cities data easier to work with, we are testing our own interactive maps of the Connecticut cities, which you can use by clicking here (after viewing the visualization, click on the “X” in the top right to return to this page). Please contact us with any questions. [2018 Update: More current versions of the visualization may be posted on our Data Dashboard page].
What is new about the 500 Cities Project? What are its strengths and limitations?
The 500 Cities Project is new in that its small-area estimation methodology makes data available for individual cities and neighborhoods throughout the country and allows for comparisons between and within cities. The estimates are not direct survey measures of health and well-being, but are based on an innovative peer-reviewed statistical approach that links survey data and high-resolution demographic and socioeconomic data from the 2014 Behavioral Risk Factor Surveillance System, a nationwide survey administered by state health departments, and the U.S. Census 2010 and American Community Survey data. Until this project, estimates for these indicators had only been available for counties, metropolitan areas, or states, or else had been directly gathered by local researchers through intensive field work on a regional, citywide, or neighborhood scale (such as through the statewide and local-level DataHaven Community Wellbeing Survey in 2015).
For a variety of reasons, including the fact that the 500 Cities data are based on a statistical model and are not direct survey measures of local populations, they should be used and compared with great caution. As this project and similar initiatives to generate small-area estimates are sustained over time, the strengths and limitations of their methodology will become more widely documented. Based on our understanding of the dataset at this point, we would recommend using it to help describe variations within Connecticut cities (keeping in mind, importantly, that estimates are not age-adjusted and therefore often reflect large differences in the average age of residents from one neighborhood to another), in conjunction with other more traditional measures of local urban health. We would not recommend using it to directly compare between individual Census tracts, or to compare one city to another, particularly when cities are not located within the same county. According to the RWJF DASH project, for example, “the current modeling procedure does not support using the estimates to track changes at the local level over time. Model-based local estimates should not be used to evaluate the impact of local public health programs, policies, or interventions. The CDC suggests using the model-based estimates as a baseline for communities to conduct their own surveys evaluating the impact of their interventions.”
Despite the potential limitations, having this data at a census tract-level is particularly useful, as it allows public health researchers and practitioners to begin to pinpoint problems within a city for targeted interventions or services. Census tracts generally have around 4,000 residents, and often follow boundaries such as highways and major streets, making them geographically relevant areas that approximate city neighborhoods. Tracts are also useful because an enormous amount of other data are available at this level. This lets us study health equity and social determinants of health—socioeconomic conditions that are often tied to advantages and disadvantages in building healthy communities.
The 500 Cities data includes Connecticut’s eight largest cities—Bridgeport, Danbury, Hartford, New Britain, New Haven, Norwalk, Stamford, and Waterbury—each made up of at least 15 tracts and, combined, home to more than 870,000 of the state’s residents. These data form a narrative of public health in Connecticut, one that revolves around a familiar story of profound disparity in the state. On several measures, we have tracts ranking among the best in the country, and, at the same time, others among the worst in the nation, all within our very small state. For example, we have 28 tracts with asthma rates that are estimated to rank in the highest tenth nationally, 13 of which are in Hartford; likewise, Hartford is home to more than half of our state’s tracts with high rankings for poor mental health. On the other end, some of our state’s very positive rankings on various aggregate measures of health—low rates of adults lacking health insurance, for example—are reflected in wealthy sections of cities such as Stamford, while several tracts in Hartford and Bridgeport rank among the nation’s least insured.
Understanding the effects of location and socioeconomic factors is central to the purpose of 500 Cities. Digging into the social determinants of health illuminates the myriad ways that the members of a community may see their individual health shaped by the wellbeing of their neighborhood or city through factors such as high unemployment, poor housing conditions, segregation, educational opportunity, and violence. Data isn’t everything, and it can never fully capture the richness of all these neighborhoods, but it helps us identify and describe needs, find underlying causes, and highlight the complexities of our communities in a way that can empower social progress.
500 Cities data: The two urban Connecticuts
The disparities made clear by the 500 Cities data are so dramatic, sometimes even within the same city, that it seems as though our urban residents live in two different health care systems. To illustrate this, DataHaven split the cities’ tracts into groups of lower-need and higher-need, clustering them based on their population density, median household income, and poverty rate. What we find are two types of urban Connecticut tracts that are like night and day. Higher-need tracts form areas that might be described as “inner-city,” as they are often within the central cores of our cities and once characterized by heavily-concentrated manufacturing industries. Lower-need tracts have characteristics that are much more like wealthier suburban areas, even though they are located within city limits (See previous work clustering Connecticut towns by similar factors). Expanding the scope of the 500 Cities project to include Connecticut’s smaller towns would make these differences even more clear, and reveal pockets of higher-need areas within many of our suburban and rural towns as well.
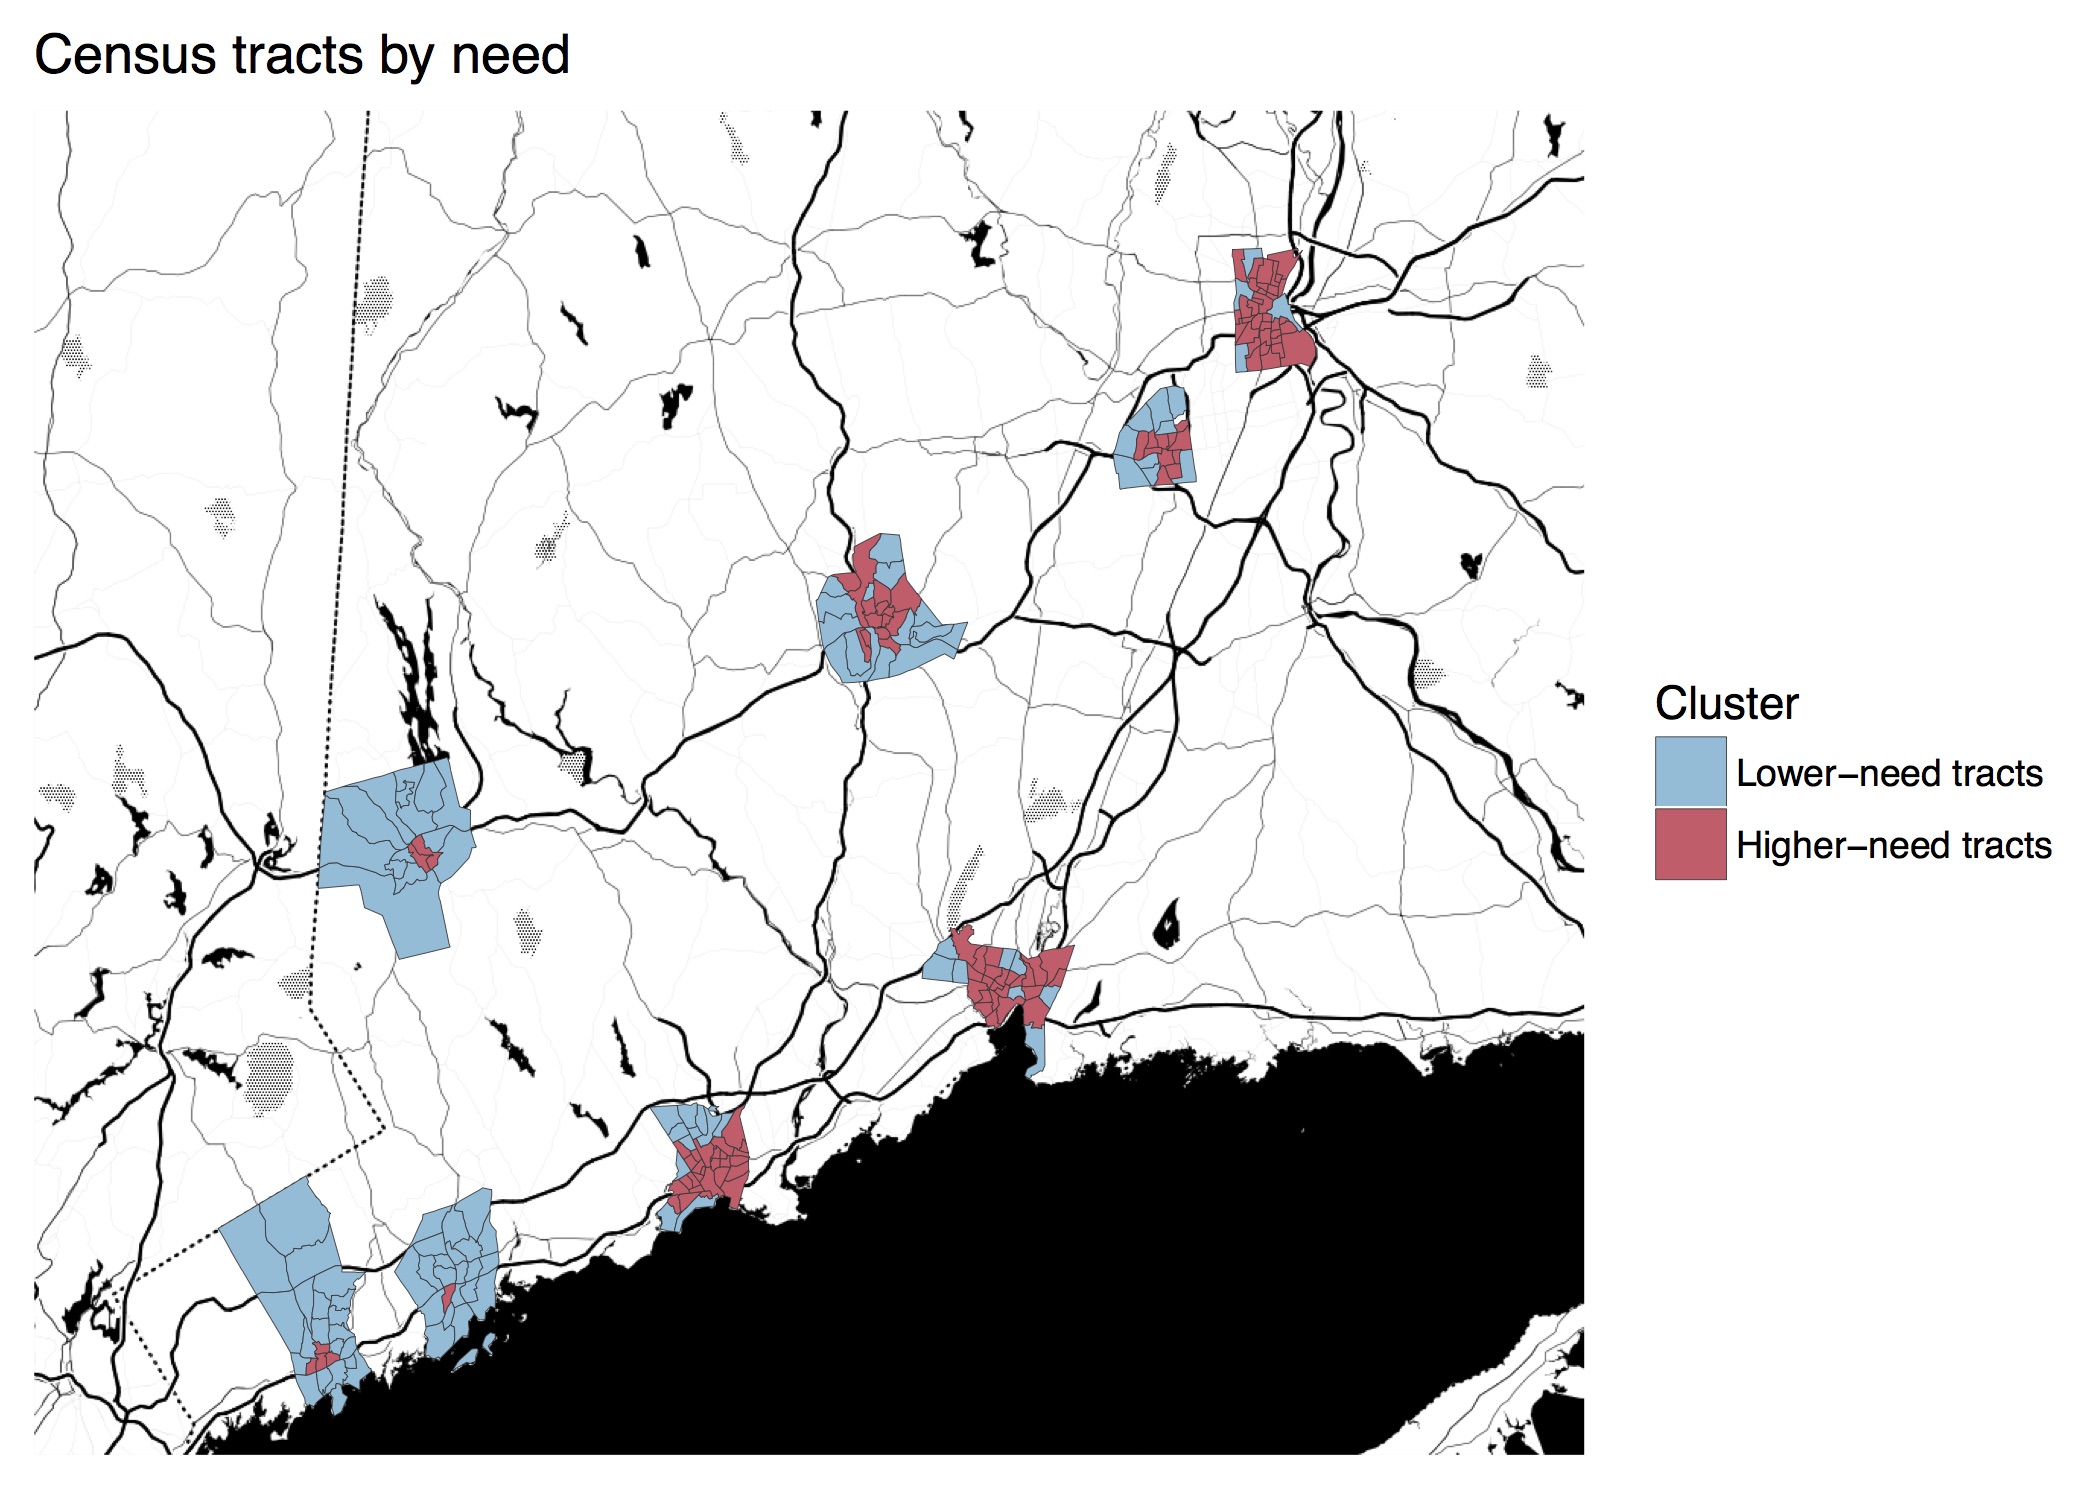
Within the eight cities that are included, the higher-need tracts are, on average, more than twice as densely populated as lower-need ones, have more than three times higher poverty rates, and have half the median household incomes. Note that these lower-need tracts, while relatively well off, are still within these eight cities.
The eight Connecticut cities’ combined populations are split about evenly between these two clusters. However, we once again see issues concentrated in some cities, as most of these higher-need tracts are in Bridgeport, New Haven, Hartford, and Waterbury. In fact, 90 percent of Hartford residents live in these higher-need tracts, while Norwalk and Stamford have much smaller, centrally-located shares of their populations living in higher-need tracts.
Once we split the tracts into these two clusters, we see a familiar pattern of better outcomes in wealthier areas. These lower-need tracts—less dense and with higher incomes and lower poverty rates—fare much better than the higher-need ones on a variety of measures, particularly among measures of preventive care and healthy behaviors. In higher-need tracts, for instance, working-age adults lack health insurance at rates 12 percentage points higher than their counterparts in lower-need tracts. Likewise, just over half of higher-need tract residents have recently seen a dentist, trailing 15 percentage points behind lower-need tracts. Significant differences appear in behavioral measures such as smoking, lack of physical activity, lack of sufficient sleep, and obesity; on all of these, we see better results in lower-need tracts. Some health outcomes where our higher-need tracts lag behind, but by smaller margins, include asthma and diabetes, as well as broad measures like mental health difficulties and self-rated overall physical health.
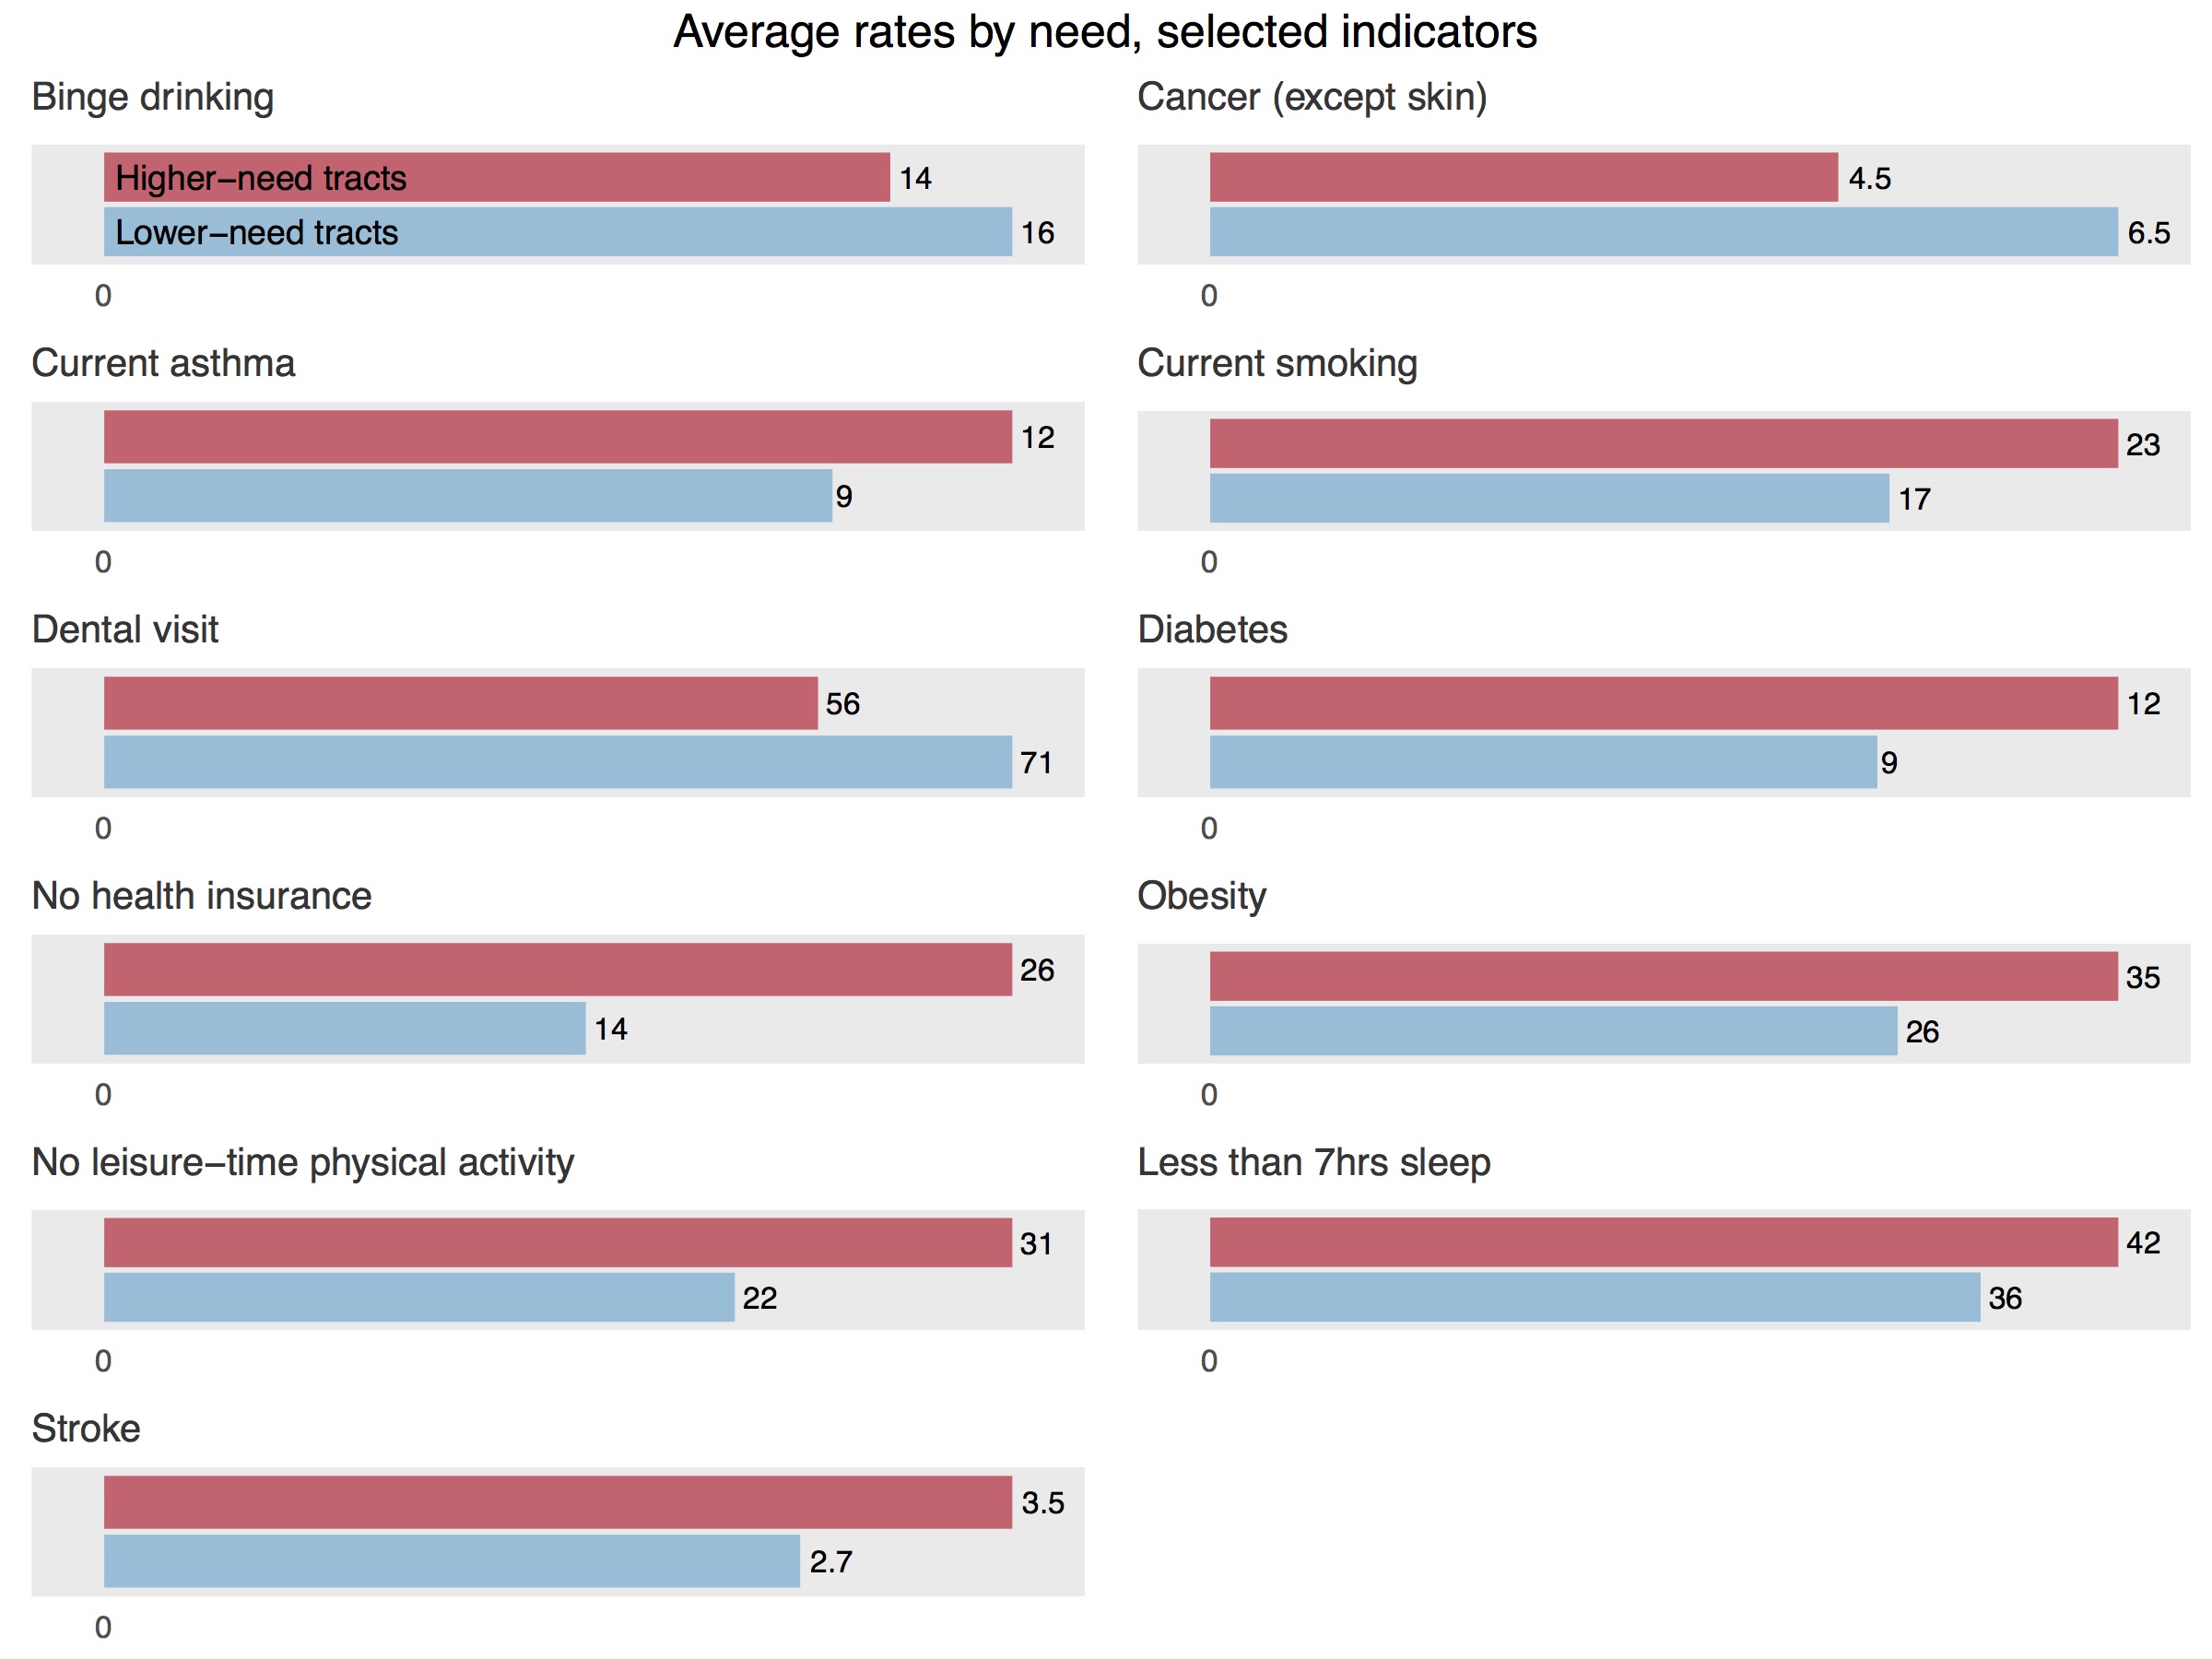
On two measures, binge drinking and cancer, we see better outcomes in higher-need tracts than lower-need ones, but this is likely due to the fact that the tract-level estimates are not age-adjusted. The way that neighborhood-by-neighborhood differences in health can be skewed by great differences in the age structure of the local population is illustrated by looking at rates of binge drinking, where one New Haven tract has the highest estimated rate in the state; this tract also has among the lowest rates of chronic kidney disease and stroke in the country. But looking closer, this tract is almost entirely made up of Yale dorms and other student housing. While binge drinking impacts people of all ages, it is much more common in areas that are disproportionately populated by adults age 18-29; in fact, most of the tracts with the state’s highest rates of binge drinking include college campuses, and are classified as lower-need. Populations in the lower-need tracts also tend to be older, so without adjusting for age, it makes sense for them to have higher cancer rates. Our 2016 article at PolicyLink uses Connecticut data to illustrate the importance of age adjustment in more detail.
One promising measure stands out: the gap between rates of annual checkups in lower-need and higher-need tracts is small, with an average of 66 percent of higher-need residents having gotten a checkup in the past year, and an average of 68 percent in lower-need tracts reporting the same. This may be a result of increased access to regular preventive care in the past few years under the Affordable Care Act and similar local measures. In general, rates of uninsurance have plummeted in lower-income neighborhoods, including in New Haven, since the implementation of this legislation.
Higher-need tracts have greater variation in the rates given by most measures; that is, among the higher-need tracts, there is more of a tendency for values to fall much higher or much lower than their average. Public health practitioners may want to pay attention to these outliers, both to target populations that are in greater need for interventions, but also to figure out what types of protective factors or demographic differences result in positive outcomes even concurrent with higher levels of neighborhood disadvantage.
Community wellbeing in the two urban Connecticuts
Within Connecticut, other data are available that can illuminate community conditions within local areas, including from DataHaven’s 2015 Community Wellbeing Survey (CWS), an unprecedented survey consisting of live interviews with over 16,000 randomly-selected Connecticut residents on issues of overall well-being, health outcomes, access to health care, community involvement, safety, economics, and employment.
The zip codes in our eight cities aren’t quite as homogenous as the corresponding census tracts, but our cities are still segregated enough to split zip codes into higher-need, those where more than 60 percent of residents live in higher-need tracts, or lower-need, those where more than 60 percent live in lower-need tracts. Of the 40 zip codes in these eight cities, only one, in the southern part of Waterbury, is evenly split between higher- and lower-need tracts. In eight zip codes, including 06519 in New Haven’s Hill neighborhood, all residents live in higher-need tracts.
By clustering zip codes into groupings similar to those that we used for census tracts, we have looked at the Community Wellbeing Survey data by neighborhood in aggregate across these eight cities. One of the strengths of this survey is that we have access to information that is otherwise difficult to measure, such as residents’ outlooks on the places they live, across multiple dimensions. It also allows us to study personal wellbeing and community wellbeing as they relate to each other. We believe that understanding issues in the lives of individuals and families is crucial to understanding issues in their community; the flip-side is true as well, as an individual’s life will be affected by their surroundings.
As is the case with the 500 Cities data, we expect some issues to be shared by city residents regardless of zip code, but other aspects of those issues to disproportionately affect higher-need areas. For example, access to quality outdoor space is a challenge for all city residents: 61 percent of adults in these eight cities rated local public parks and recreation facilities to be in excellent or good condition, compared to 76 percent of participants throughout the state. Yet, in higher-need city zip codes—those with greater density and where residents have fewer economic resources—survey participants are even less likely to feel that they have decent outdoor facilities nearby, with only 53 percent of them rating their parks as excellent or good.
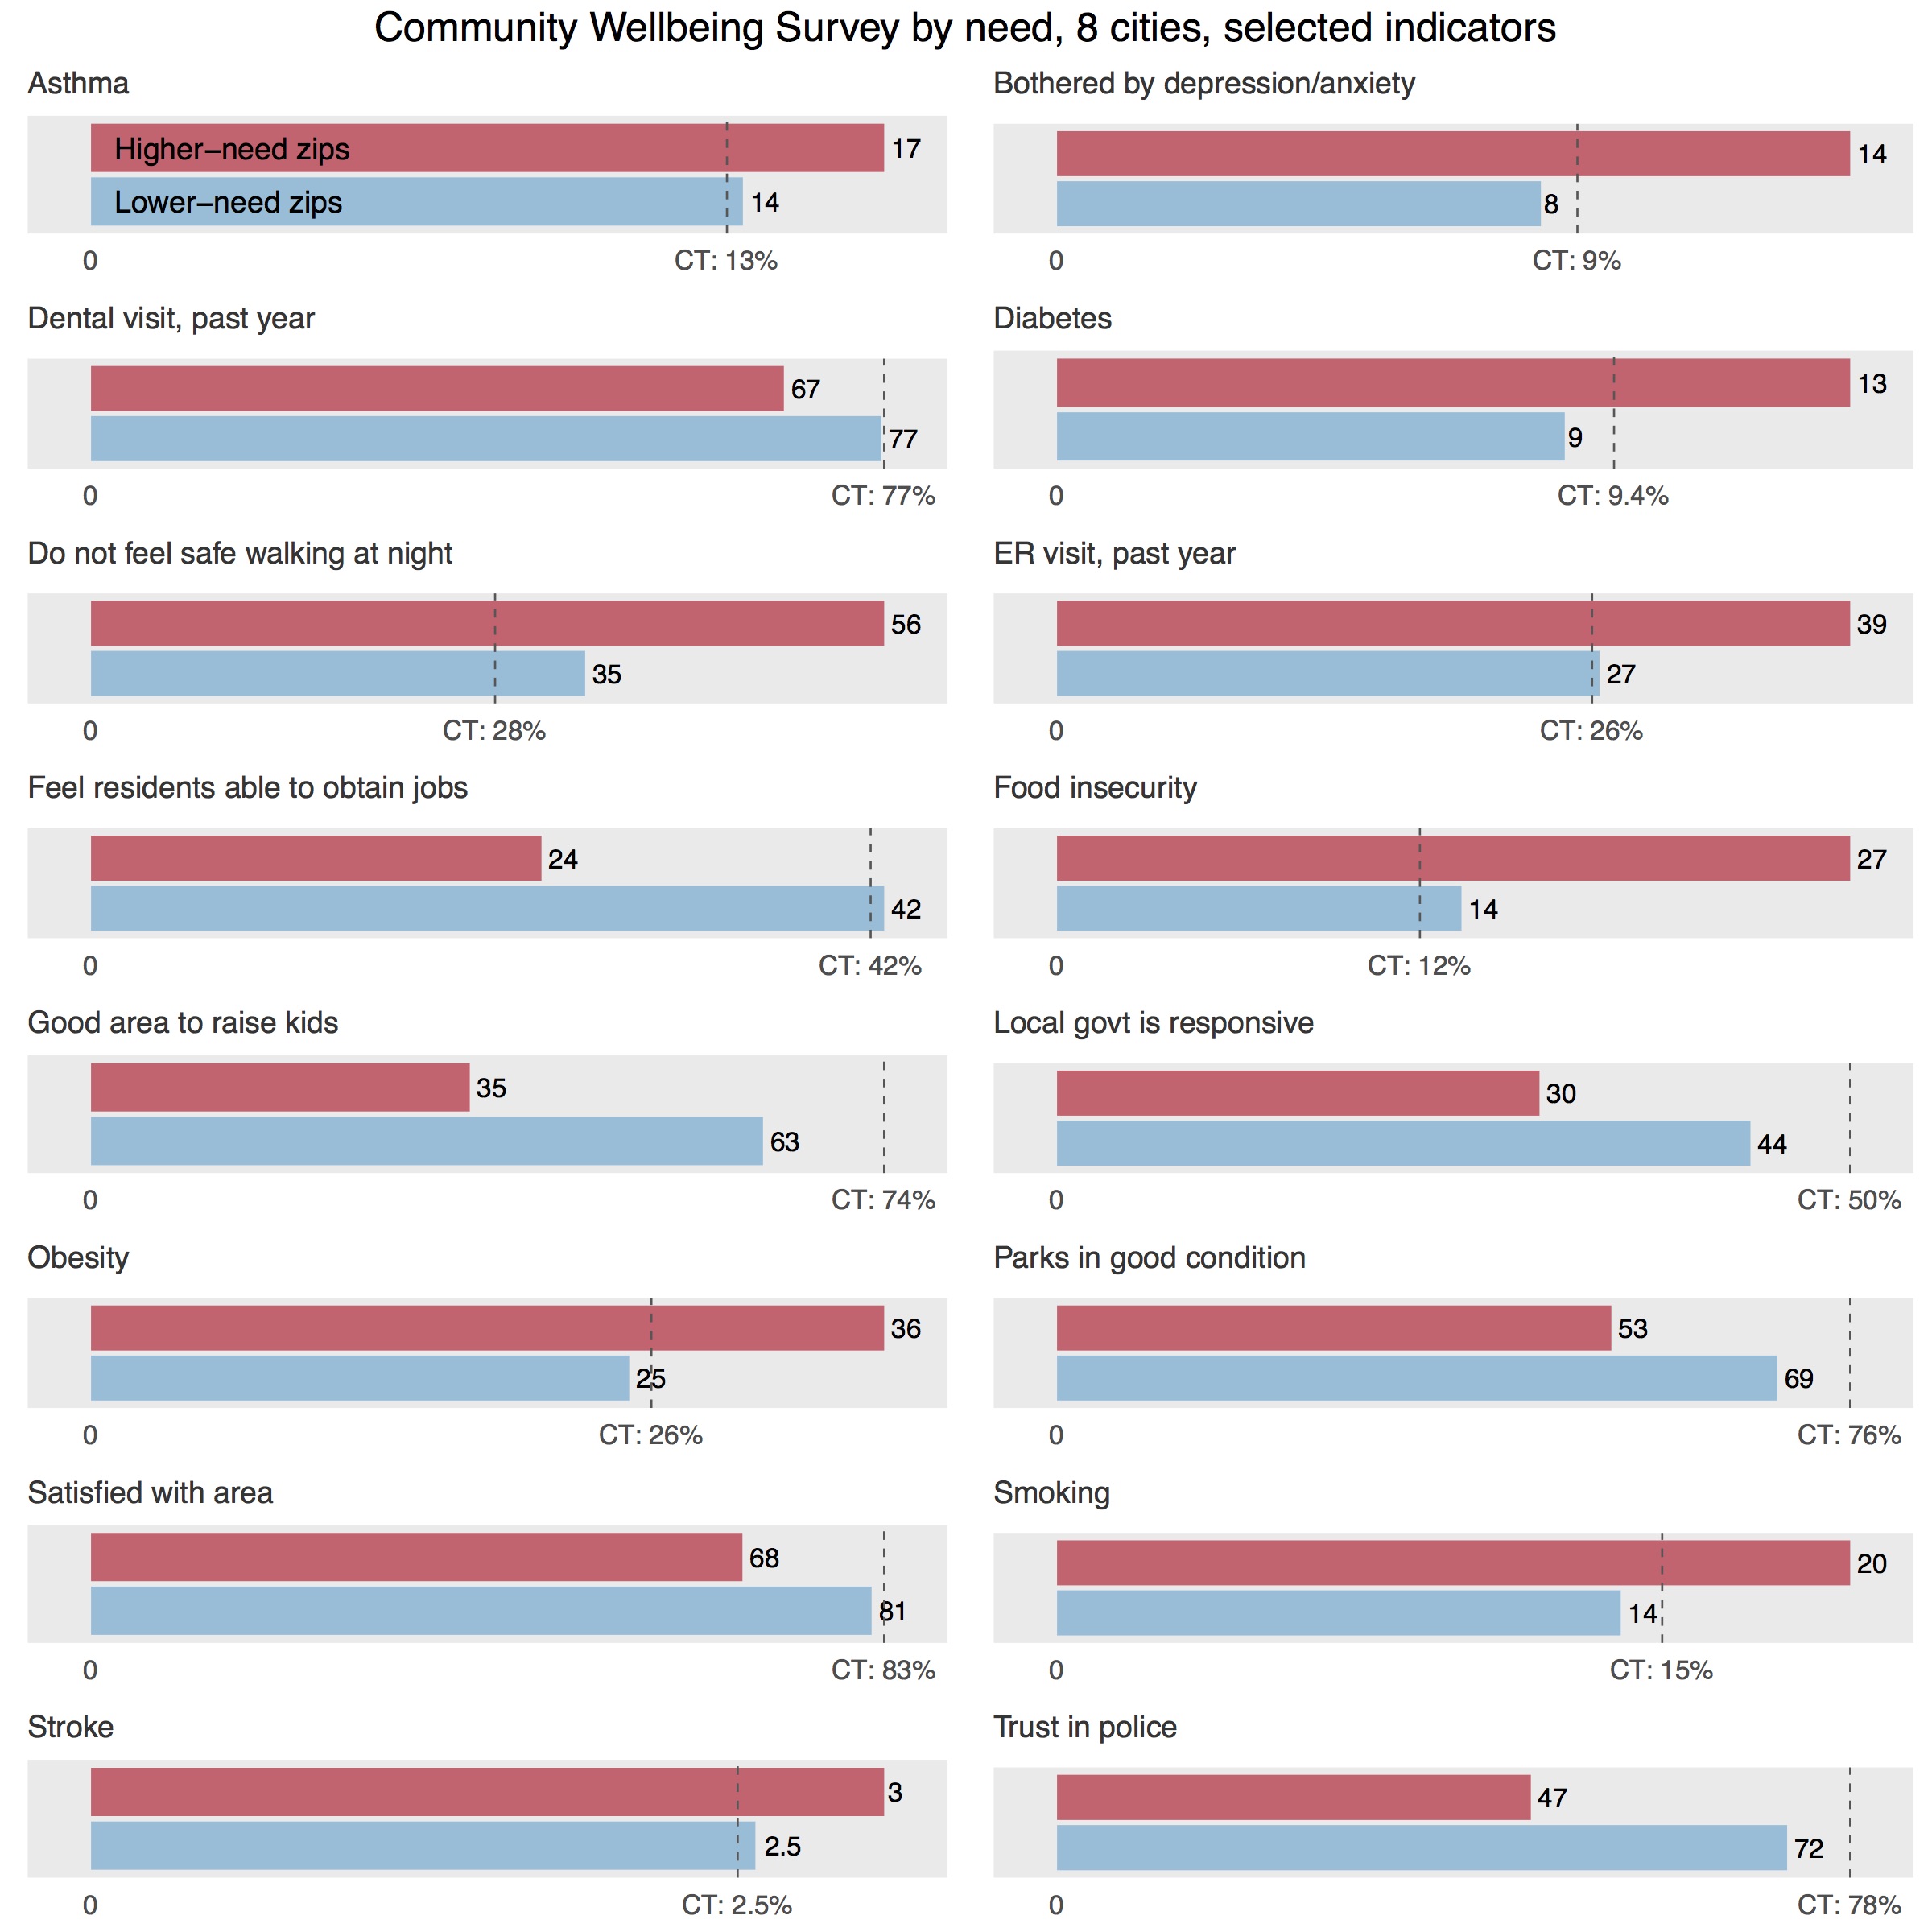
Some CWS questions identify disparities between these clusters that may have ripple effects into other aspects of people’s lives. City residents in higher-need zip codes are more likely to report being bothered by depression or anxiety on a regular basis (14 percent) than in lower-need zips (8 percent); these mental health challenges easily carry over into other areas of wellbeing and quality of life. Higher-need zips have twice the rate of adults reporting food insecurity at some point in the past year than lower-need zips (27 percent versus 14 percent), which studies show can have far-reaching, lasting effects on people’s lives and children’s development. Residents of higher-need zips are also more likely to have been in the emergency room at least once in the past year. While frequent ER visits may be related to higher incidence of chronic disease or emergencies such as injuries, they often occur in lieu of preventive care that lower-income residents don’t have access to. Our new Fairfield County Community Wellbeing Index and Greater New Haven Community Index 2016, for example, contain maps that show particularly large disparities by neighborhood in the rates of emergency room visits for preventable dental conditions.
On several questions of community life, we once again see two distinct urban Connecticuts. To be fair, the higher-need zip codes aren’t doled out evenly between the cities: Norwalk and Danbury are made up entirely of lower-need zips, while Stamford has just one higher-need zip downtown. Hartford, on the other hand, has all but one of its zip codes classified as higher-need.
However, we might still expect some continuity within cities in responses to these questions about people’s neighborhoods. More than half of the residents of higher-need zips report feeling unsafe walking at night, while only 35 percent of lower-need residents report the same. From our work on this issue over the past 10 years (including more finely-grained neighborhood analysis of survey responses by census tract or city block), we know that neighborhood safety issues may be even more concentrated in a few small geographic areas. Likewise, in 2015, 42 percent of residents in lower-need zips feel residents have a decent ability to obtain a job, compared to only 24 percent in higher-need zips (these figures were even worse in surveys that we conducted in 2012, at the peak of the last major recession). These residents are theoretically entering the same job markets, but they may feel like they or their neighbors are going in with markedly different opportunities and advantages.
Similarly, residents’ views on local government differ by zip code. Less than a third of higher-need residents felt their local government is responsive to their needs, compared to 44 percent of lower-need residents served by—again, theoretically—the same governments. Seventy-two percent of residents in lower-need zips rate the job done by police as excellent or good, while only 47 percent of higher-need residents do. The largest gap between the two groups was on participants’ rating of whether their area is a good place to raise kids: only 35 percent of residents in higher-need zips felt this was true, 27 percentage points below the figure reported by residents of lower-need zips.
Despite shouldering undue burdens, however, residents in higher-need zips more often than not report being satisfied with their area. Sixty-eight percent of higher-need residents say they are satisfied with their city; 81 percent of residents in lower-need zips feel the same way. While this is still a large gap, it signals that there is great resilience in the higher-need zip codes, affecting residents’ outlooks on their communities in spite of the problems they may face.
Close up: New Haven
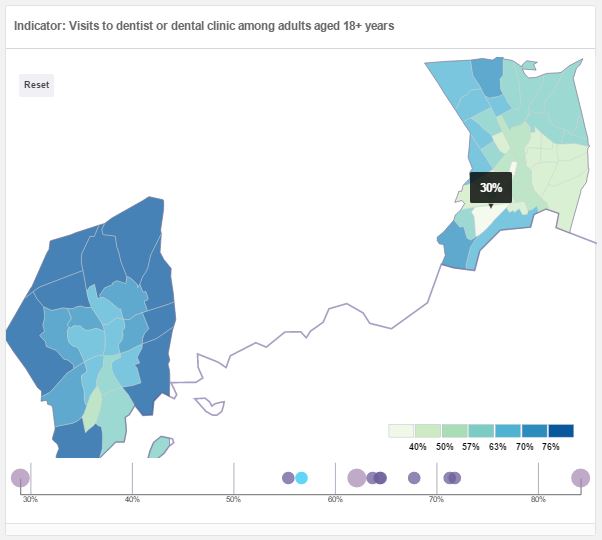
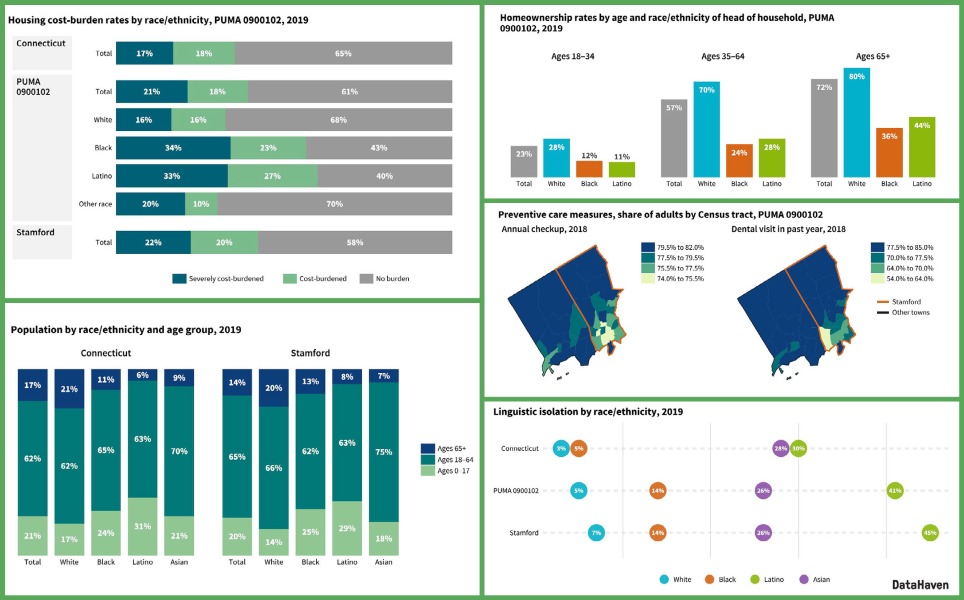
Next, we can zoom in on New Haven to see how these differences play out within our city and between our city and others. Generally, the 500 Cities data and Community Wellbeing Survey data for New Haven is similar to that for the eight cities combined. For example, rates of dental visits vary widely across neighborhoods (image is from our data viewer; see above).
Compared to the cities overall, New Haveners have less favorable ratings of our parks and police, are more skeptical of our residents’ ability to get a job, feel less safe walking at night, and are less likely to think our neighborhoods are good places to raise children. Yet, we’re largely content: 78 percent of New Haven adults surveyed are satisfied with living here, just higher than the 75 percent of the eight city residents.
We generally see smaller gaps between higher- and lower-need zips within New Haven than across all eight cities. In some cases, we fare the same regardless of zip code, for better or worse: for example, New Haveners across groupings are equally pessimistic about residents’ ability to obtain jobs. This may be due to proximity: It is likely that residents of New Haven’s wealthier areas are more familiar with the employment challenges found in adjacent sections of their own city than, say, Stamford residents would be familiar with the challenges within low-income sections of Bridgeport. We might have expected large variations when looking across all cities, as the distribution of higher- and lower-need zip codes is unbalanced between cities. But when seen in the neighborhoods within New Haven, these gaps feel more troubling: there’s a 12 percentage point gap in ratings of the responsiveness of the same local government, an 11 percentage point gap in trust in the same police department, and an 18 percentage point gap in feeling safe walking at night in the same city. Clearly these are quality of life disparities that need to be addressed at a very local level (click here for a previous analysis of the community wellbeing data by neighborhood, based on the city’s Promise Zone boundaries, which are more finely-grained and therefore reveal much larger disparities by place within the city).

And yet, there are also signs of resilience. Unlike the other cities, residents of higher-need zip codes in New Haven appear to be less likely than those of lower-need zips to report being bothered by depression and anxiety. Again, breaking down data into these clusters can help us not just identify problems to fix, but also recognize the strengths and assets of higher-need communities.
Linking community wellbeing and health
To put this data into action, one next step is to promote community-wide understanding and discussion of the links between community wellbeing data and public health measures. We can follow a thread through several seemingly related measures: for example, higher-need areas in Connecticut have higher rates of obesity, are more likely to go without leisure-time physical activity, feel less safe walking at night, and give lower ratings to the quality of nearby parks and outdoor facilities. While correlation does not equal causation, a growing amount of research suggests that there are connections to be made.
Family fitness promotion programs, for instance, may want to experiment with targeting densely-populated areas further away from parks, improving the quality of outdoor spaces there or organizing neighborhood walks that can increase residents’ sense of safety. Given the higher incidence of many chronic diseases in areas where residents also deal with much higher rates of food insecurity, local food pantries may try teaming more closely with nutrition experts or offering health screenings, as some already do. Maybe the large share of adults not getting sufficient sleep in Connecticut’s highest-need areas is related to higher rates of depression and anxiety, less of a sense of safety, or stress related to family economic security or housing, and could be alleviated through health supports that meet the specific needs of those communities.
Bridging together new sources of data can help us better see patterns within and between our communities, and allows individuals and organizations to work better between sectors. It also can help us better understand the strengths and successes of our higher-need areas.
Community data without stigma
There are real people, living in real communities, behind each of these numbers. It’s easy for those of us who work with data every day to get lost in a statistic without understanding the lives of the people that number seeks to describe. We collect numbers to identify problems, but rather than getting stuck there, we can then focus on solutions aided, or not, by more numbers. This is particularly important in talking about data on neighborhoods: it would be a mistake to use this wealth of data to simply paint a picture of doom and gloom in lower-income urban neighborhoods. Behind those data points are many people (ourselves included) who have built communities that they love out of these higher-need tracts, in spite of the burdens that may make us show up as simply hot spots on a map.
One panelist at the 500 Cities launch event asked what type of stigma can come from tossing around data points such as these without a conversation. We believe that when data is made accessible, when community members are armed with numbers and tools to describe their lives instead of distilled into two-dimensional statistics, that data can be put into action. Neighborhood data on health and wellbeing seems like a great, empowering place to start. As a non-profit organization with a long history of public service to Connecticut, we have been actively reaching out to many cross-sector groups and government agencies to inform them about the existence of these innovative new data resources (prior to their broader publication), to explain their strengths and limitations, and to discuss how they can be used. We will incorporate these findings into our work going forward, and continue to engage local residents and organizations as part of our broader work.
Camille Seaberry is Research Associate and Mark Abraham is Executive Director at DataHaven, a formal partner of the National Neighborhood Indicators Partnership with a 25-year history of public service to Greater New Haven and Connecticut. DataHaven’s mission is to improve quality of life by collecting, sharing and interpreting public data for effective decision making.
Related Reports
Related Data
Data Resource
Connecticut Town Data Viewer
Document
Disability in Connecticut: Insights from the DataHaven Community Wellbeing Survey (PDF)
Dataset, Document
Dataset, Document
DataHaven HR1 Tax Effects Spreadsheet by Connecticut Town
Document
Wilton Town Equity Report 2025
Document
Winchester Town Equity Report 2025
Document